
SPECpower_ssj2008
Aggregate Performance Report
Copyright © 2007-2026 Standard Performance Evaluation Corporation
| Compal Electronics, Inc. SD223-8A | ssj_ops@100% = 57,260,598 ssj_ops@100% per Host = 14,315,150 ssj_ops@100% per JVM = 223,674 |
||||
| Test Sponsor: | Compal Electronics, Inc. | SPEC License #: | 6857 | Test Method: | Multi Node |
| Tested By: | Compal Electronics, Inc. | Test Location: | Neihu Dist, Taipei City, Taiwan (R.O.C.) | Test Date: | Feb 10, 2026 |
| Hardware Availability: | May-2025 | Software Availability: | Sep-2025 | Publication: | Mar 17, 2026 |
| System Source: | Single Supplier | System Designation: | Server | Power Provisioning: | Line-powered |
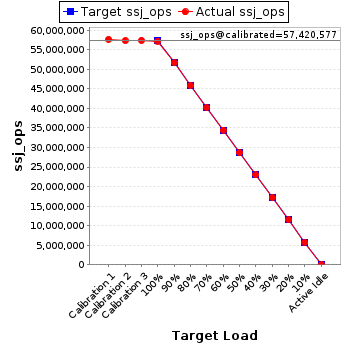
| Target Load | Actual Load | ssj_ops | |
|---|---|---|---|
| Target | Actual | ||
| Calibration 1 | 57,725,365 | ||
| Calibration 2 | 57,375,847 | ||
| Calibration 3 | 57,465,306 | ||
| ssj_ops@calibrated=57,420,577 | |||
| 100% | 99.7% | 57,420,577 | 57,260,598 |
| 90% | 90.0% | 51,678,519 | 51,681,983 |
| 80% | 80.0% | 45,936,461 | 45,938,940 |
| 70% | 70.0% | 40,194,404 | 40,195,923 |
| 60% | 60.0% | 34,452,346 | 34,459,712 |
| 50% | 50.0% | 28,710,288 | 28,686,524 |
| 40% | 40.0% | 22,968,231 | 22,967,565 |
| 30% | 30.0% | 17,226,173 | 17,211,693 |
| 20% | 20.0% | 11,484,115 | 11,481,718 |
| 10% | 10.0% | 5,742,058 | 5,737,201 |
| Active Idle | 0 | 0 | |
| # of Nodes | # of Chips | # of Cores | # of Threads | Total RAM (GB) | # of OS Images | # of JVM Instances |
|---|---|---|---|---|---|---|
| 4 | 8 | 256 | 512 | 1,536 | 4 | 256 |
| Set Identifier: | sut |
| Set Description: | System Under Test |
| # of Identical Nodes: | 4 |
| Comment: | SUT |
| Hardware per Node | |
|---|---|
| Hardware Vendor: | Compal Electronics, Inc. |
| Model: | SD223-8A |
| Form Factor: | 2U |
| CPU Name: | AMD EPYC 9355 3.55 GHz |
| CPU Characteristics: | 32 core, 3.55GHz, 256MB L3 Cache |
| CPU Frequency (MHz): | 3550 |
| CPU(s) Enabled: | 64 cores, 2 chips, 32 cores/chip |
| Hardware Threads: | 128 (2 / core) |
| CPU(s) Orderable: | 1,2 chips |
| Primary Cache: | 48 KB I + 48 KB D on chip per core |
| Secondary Cache: | 1 MB I+D on chip per core |
| Tertiary Cache: | 256 MB I+D on chip per chip, 32 MB shared/4 cores |
| Other Cache: | None |
| Memory Amount (GB): | 384 |
| # and size of DIMM: | 24 x 16384 MB |
| Memory Details: | [16GB 1Rx8 PC5-4800; slots A0, B0, C0, D0, E0, F0, G0 ,H0 ,I0 ,J0 ,K0 ,L0 populated] |
| Power Supply Quantity and Rating (W): | None |
| Power Supply Details: | Shared |
| Disk Drive: | 1 x 960G M.2 NVMe Express SSD, Micron p/n MTFDKBA960TFR-1BC1ZABDA |
| Disk Controller: | Integrated PCIe controller |
| # and type of Network Interface Cards (NICs) Installed: | 1 x PCIE i350 4-port, LR-LINK p/n LREC9714HT-PCIE |
| NICs Enabled in Firmware / OS / Connected: | 4/4/1 |
| Network Speed (Mbit): | 1000 |
| Keyboard: | None |
| Mouse: | None |
| Monitor: | None |
| Optical Drives: | No |
| Other Hardware: | None |
| Software per Node | |
|---|---|
| Power Management: | Preferred plans in OS: Power Saver (see SUT Notes) |
| Operating System (OS): | Microsoft Windows Server 2022 Datacenter Evaluation |
| OS Version: | Version 21H2 (OS Build 20348.4648) |
| Filesystem: | NTFS |
| JVM Vendor: | Oracle |
| JVM Version: | "17.0.12" 2024-07-16 LTS Java(TM) SE Runtime Environment (build 17.0.12+8-LTS-286) Java HotSpot(TM) 64-Bit Server VM (build 17.0.12+8-LTS-286, mixed mode, sharing) |
| JVM Command-line Options: | -server -Xmn1450m -Xms1650m -Xmx1650m -XX:ParallelGCThreads=2 -XX:+UseLargePages -XX:LargePageSizeInBytes=2m -XX:UseAVX=0 -XX:AutoBoxCacheMax=20000 -XX:+UseParallelGC -XX:+OptimizeFill -XX:+AggressiveHeap -XX:FreqInlineSize=2500 -XX:InlineSmallCode=3900 -XX:+UseBiasedLocking -XX:AllocatePrefetchDistance=256 -XX:AllocatePrefetchLines=8 -XX:+UseNUMA |
| JVM Affinity: | start /NODE [0-15] /AFFINITY [0x3,0xC,0x30,0xC0] |
| JVM Instances: | 64 |
| JVM Initial Heap (MB): | 2048 |
| JVM Maximum Heap (MB): | 2048 |
| JVM Address Bits: | 64 |
| Boot Firmware Version: | 2.12.0 |
| Management Firmware Version: | 1.29.0 |
| Workload Version: | SSJ 1.2.10 |
| Director Location: | Controller |
| Other Software: | None |
AMI Aptio Setup Utility :
| Host | ssj_ops@100% |
|---|---|
| NODE1 | 14,335,993 |
| NODE2 | 14,298,403 |
| NODE3 | 14,314,215 |
| NODE4 | 14,311,987 |
| ssj_ops@100% | 57,260,598 |
| ssj_ops@100% per Host | 14,315,150 |
| ssj_ops@100% per JVM | 223,674 |

| Target Load | Actual Load | ssj_ops | |
|---|---|---|---|
| Target | Actual | ||
| Calibration 1 | 14,466,930 | ||
| Calibration 2 | 14,367,965 | ||
| Calibration 3 | 14,385,403 | ||
| ssj_ops@calibrated=14,376,684 | |||
| 100% | 99.7% | 14,376,684 | 14,335,993 |
| 90% | 89.9% | 12,939,015 | 12,928,643 |
| 80% | 80.0% | 11,501,347 | 11,504,408 |
| 70% | 70.0% | 10,063,679 | 10,061,577 |
| 60% | 60.0% | 8,626,010 | 8,626,679 |
| 50% | 49.9% | 7,188,342 | 7,180,436 |
| 40% | 40.0% | 5,750,674 | 5,751,155 |
| 30% | 30.0% | 4,313,005 | 4,309,061 |
| 20% | 20.0% | 2,875,337 | 2,878,783 |
| 10% | 10.0% | 1,437,668 | 1,434,152 |
| Active Idle | 0 | 0 | |

| Target Load | Actual Load | ssj_ops | |
|---|---|---|---|
| Target | Actual | ||
| Calibration 1 | 14,414,668 | ||
| Calibration 2 | 14,327,357 | ||
| Calibration 3 | 14,356,304 | ||
| ssj_ops@calibrated=14,341,831 | |||
| 100% | 99.7% | 14,341,831 | 14,298,403 |
| 90% | 90.1% | 12,907,648 | 12,919,117 |
| 80% | 80.0% | 11,473,465 | 11,476,272 |
| 70% | 70.0% | 10,039,282 | 10,035,500 |
| 60% | 60.1% | 8,605,098 | 8,614,529 |
| 50% | 50.0% | 7,170,915 | 7,168,459 |
| 40% | 40.0% | 5,736,732 | 5,736,765 |
| 30% | 30.0% | 4,302,549 | 4,298,810 |
| 20% | 20.0% | 2,868,366 | 2,867,975 |
| 10% | 10.0% | 1,434,183 | 1,435,391 |
| Active Idle | 0 | 0 | |

| Target Load | Actual Load | ssj_ops | |
|---|---|---|---|
| Target | Actual | ||
| Calibration 1 | 14,426,132 | ||
| Calibration 2 | 14,342,121 | ||
| Calibration 3 | 14,370,684 | ||
| ssj_ops@calibrated=14,356,402 | |||
| 100% | 99.7% | 14,356,402 | 14,314,215 |
| 90% | 90.0% | 12,920,762 | 12,924,584 |
| 80% | 80.0% | 11,485,122 | 11,479,664 |
| 70% | 70.0% | 10,049,482 | 10,048,201 |
| 60% | 60.0% | 8,613,841 | 8,620,563 |
| 50% | 50.0% | 7,178,201 | 7,177,546 |
| 40% | 40.0% | 5,742,561 | 5,745,224 |
| 30% | 30.0% | 4,306,921 | 4,300,473 |
| 20% | 20.0% | 2,871,280 | 2,866,669 |
| 10% | 10.0% | 1,435,640 | 1,433,165 |
| Active Idle | 0 | 0 | |

| Target Load | Actual Load | ssj_ops | |
|---|---|---|---|
| Target | Actual | ||
| Calibration 1 | 14,417,636 | ||
| Calibration 2 | 14,338,404 | ||
| Calibration 3 | 14,352,916 | ||
| ssj_ops@calibrated=14,345,660 | |||
| 100% | 99.8% | 14,345,660 | 14,311,987 |
| 90% | 90.0% | 12,911,094 | 12,909,639 |
| 80% | 80.0% | 11,476,528 | 11,478,595 |
| 70% | 70.1% | 10,041,962 | 10,050,646 |
| 60% | 59.9% | 8,607,396 | 8,597,941 |
| 50% | 49.9% | 7,172,830 | 7,160,083 |
| 40% | 40.0% | 5,738,264 | 5,734,421 |
| 30% | 30.0% | 4,303,698 | 4,303,350 |
| 20% | 20.0% | 2,869,132 | 2,868,291 |
| 10% | 10.0% | 1,434,566 | 1,434,494 |
| Active Idle | 0 | 0 | |
