
SPECpower_ssj2008
Aggregate Performance Report
Copyright © 2007-2019 Standard Performance Evaluation Corporation
| Hewlett Packard Enterprise Synergy 660 Gen10 Compute Module | ssj_ops@100% = 57,344,378 ssj_ops@100% per Host = 11,468,876 ssj_ops@100% per JVM = 1,433,609 |
||||
| Test Sponsor: | Hewlett Packard Enterprise | SPEC License #: | 3 | Test Method: | Multi Node |
| Tested By: | Hewlett Packard Enterprise | Test Location: | Houston, TX, USA | Test Date: | Mar 9, 2019 |
| Hardware Availability: | Apr-2019 | Software Availability: | Mar-2019 | Publication: | Apr 2, 2019 |
| System Source: | Single Supplier | System Designation: | Server | Power Provisioning: | Line-powered |
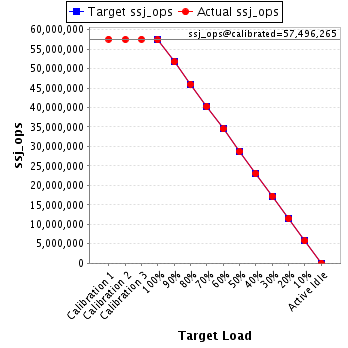
| Target Load | Actual Load | ssj_ops | |
|---|---|---|---|
| Target | Actual | ||
| Calibration 1 | 57,538,783 | ||
| Calibration 2 | 57,461,684 | ||
| Calibration 3 | 57,530,847 | ||
| ssj_ops@calibrated=57,496,265 | |||
| 100% | 99.7% | 57,496,265 | 57,344,378 |
| 90% | 90.0% | 51,746,639 | 51,748,240 |
| 80% | 80.0% | 45,997,012 | 46,004,723 |
| 70% | 70.0% | 40,247,386 | 40,245,799 |
| 60% | 60.0% | 34,497,759 | 34,484,272 |
| 50% | 50.0% | 28,748,133 | 28,739,343 |
| 40% | 40.0% | 22,998,506 | 23,011,529 |
| 30% | 30.0% | 17,248,880 | 17,264,325 |
| 20% | 20.0% | 11,499,253 | 11,501,932 |
| 10% | 10.0% | 5,749,627 | 5,744,055 |
| Active Idle | 0 | 0 | |
| # of Nodes | # of Chips | # of Cores | # of Threads | Total RAM (GB) | # of OS Images | # of JVM Instances |
|---|---|---|---|---|---|---|
| 5 | 20 | 560 | 1,120 | 1,920 | 5 | 40 |
| Set Identifier: | SUT |
| Set Description: | System Under Test |
| # of Identical Nodes: | 5 |
| Comment: | SUT |
| Hardware per Node | |
|---|---|
| Hardware Vendor: | Hewlett Packard Enterprise |
| Model: | Synergy 660 Gen10 Compute Module |
| Form Factor: | blade |
| CPU Name: | Intel Xeon Platinum 8280 @ 2.70GHz (Intel Turbo Boost Technology up to 4.00 GHz) |
| CPU Characteristics: | 28-Core, 2.70 GHz, 38.5MB L3 Cache |
| CPU Frequency (MHz): | 2700 |
| CPU(s) Enabled: | 112 cores, 4 chips, 28 cores/chip |
| Hardware Threads: | 224 (2 / core) |
| CPU(s) Orderable: | 1,2,3,4 chips |
| Primary Cache: | 32 KB I + 32 KB D on chip per core |
| Secondary Cache: | 1 MB I+D on chip per core |
| Tertiary Cache: | 39424 KB I+D on chip per chip |
| Other Cache: | None |
| Memory Amount (GB): | 384 |
| # and size of DIMM: | 24 x 16384 MB |
| Memory Details: | 24 x 16GB 2Rx8 PC4-2933Y-R; slots 1, 3, 5, 8, 10 and 12 populated on each socket |
| Power Supply Quantity and Rating (W): | None |
| Power Supply Details: | N/A |
| Disk Drive: | 1 x HPE 480GB SATA 6G M.2 2280 (875498-B21) |
| Disk Controller: | HPE Smart Array S100i SR Gen10 |
| # and type of Network Interface Cards (NICs) Installed: | 1 x HPE Synergy 3820C 10/20Gb CNA |
| NICs Enabled in Firmware / OS / Connected: | 2/2/1 |
| Network Speed (Mbit): | 1000 |
| Keyboard: | None |
| Mouse: | None |
| Monitor: | None |
| Optical Drives: | No |
| Other Hardware: | None |
| Software per Node | |
|---|---|
| Power Management: | Enabled (see SUT Notes) |
| Operating System (OS): | Windows Server 2012 R2 Datacenter |
| OS Version: | Version 6.3 (Build 9600) |
| Filesystem: | NTFS |
| JVM Vendor: | Oracle Corporation |
| JVM Version: | Oracle Java HotSpot(TM) 64-Bit Server VM (build 24.80-b11, mixed mode), version 1.7.0_80 |
| JVM Command-line Options: | -server -Xmn19000m -Xms21000m -Xmx21000m -XX:SurvivorRatio=1 -XX:TargetSurvivorRatio=99 -XX:AllocatePrefetchDistance=256 -XX:AllocatePrefetchLines=4 -XX:LoopUnrollLimit=45 -XX:InitialTenuringThreshold=12 -XX:MaxTenuringThreshold=15 -XX:ParallelGCThreads=28 -XX:InlineSmallCode=3900 -XX:MaxInlineSize=270 -XX:FreqInlineSize=2500 -XX:+AggressiveOpts -XX:+UseLargePages -XX:+UseParallelOldGC |
| JVM Affinity: | start /NODE [0,1,2,3] /AFFINITY [0xFFFFFFF] |
| JVM Instances: | 8 |
| JVM Initial Heap (MB): | 21000 |
| JVM Maximum Heap (MB): | 21000 |
| JVM Address Bits: | 64 |
| Boot Firmware Version: | I43 v2.10 (01/18/2019) |
| Management Firmware Version: | 1.40 Feb 05 2019 |
| Workload Version: | SSJ 1.2.10 |
| Director Location: | Controller |
| Other Software: | HPE Service Pack for ProLiant (SPP) - Version 2019.03.0 (Mar 2019), Microsoft Windows KB4054519, and KB4056898 |
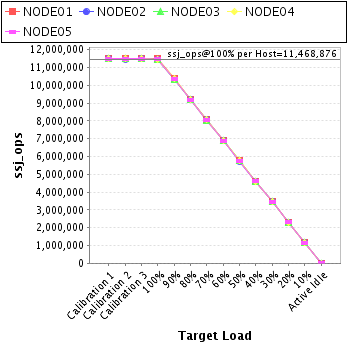
| Host | ssj_ops@100% |
|---|---|
| NODE01 | 11,490,654 |
| NODE02 | 11,465,014 |
| NODE03 | 11,460,530 |
| NODE04 | 11,472,740 |
| NODE05 | 11,455,440 |
| ssj_ops@100% | 57,344,378 |
| ssj_ops@100% per Host | 11,468,876 |
| ssj_ops@100% per JVM | 1,433,609 |
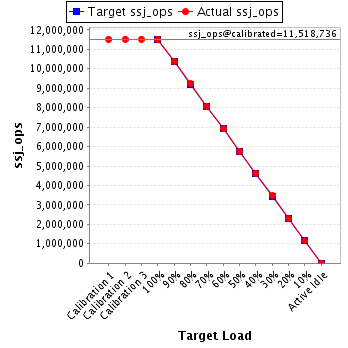
| Target Load | Actual Load | ssj_ops | |
|---|---|---|---|
| Target | Actual | ||
| Calibration 1 | 11,519,232 | ||
| Calibration 2 | 11,515,628 | ||
| Calibration 3 | 11,521,845 | ||
| ssj_ops@calibrated=11,518,736 | |||
| 100% | 99.8% | 11,518,736 | 11,490,654 |
| 90% | 90.0% | 10,366,863 | 10,364,625 |
| 80% | 80.0% | 9,214,989 | 9,219,368 |
| 70% | 70.0% | 8,063,115 | 8,066,462 |
| 60% | 60.0% | 6,911,242 | 6,914,262 |
| 50% | 50.0% | 5,759,368 | 5,758,362 |
| 40% | 40.0% | 4,607,494 | 4,612,852 |
| 30% | 30.1% | 3,455,621 | 3,472,733 |
| 20% | 20.0% | 2,303,747 | 2,300,749 |
| 10% | 10.0% | 1,151,874 | 1,148,781 |
| Active Idle | 0 | 0 | |
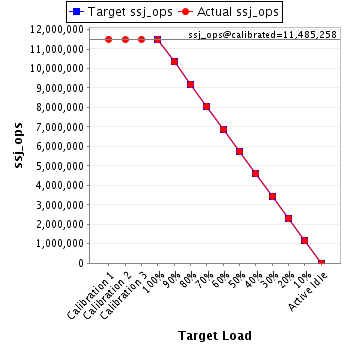
| Target Load | Actual Load | ssj_ops | |
|---|---|---|---|
| Target | Actual | ||
| Calibration 1 | 11,504,734 | ||
| Calibration 2 | 11,472,989 | ||
| Calibration 3 | 11,497,527 | ||
| ssj_ops@calibrated=11,485,258 | |||
| 100% | 99.8% | 11,485,258 | 11,465,014 |
| 90% | 90.0% | 10,336,732 | 10,332,974 |
| 80% | 80.0% | 9,188,206 | 9,185,026 |
| 70% | 70.1% | 8,039,681 | 8,049,680 |
| 60% | 59.9% | 6,891,155 | 6,885,236 |
| 50% | 50.0% | 5,742,629 | 5,740,572 |
| 40% | 40.0% | 4,594,103 | 4,595,502 |
| 30% | 30.0% | 3,445,577 | 3,446,770 |
| 20% | 20.0% | 2,297,052 | 2,296,875 |
| 10% | 10.0% | 1,148,526 | 1,146,591 |
| Active Idle | 0 | 0 | |
| Target Load | Actual Load | ssj_ops | |
|---|---|---|---|
| Target | Actual | ||
| Calibration 1 | 11,504,797 | ||
| Calibration 2 | 11,485,736 | ||
| Calibration 3 | 11,503,258 | ||
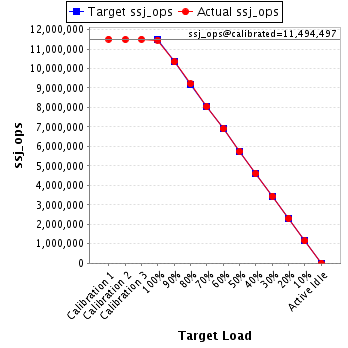
| ssj_ops@calibrated=11,494,497 | |||
| 100% | 99.7% | 11,494,497 | 11,460,530 |
| 90% | 90.0% | 10,345,047 | 10,343,952 |
| 80% | 80.1% | 9,195,598 | 9,207,594 |
| 70% | 69.9% | 8,046,148 | 8,038,684 |
| 60% | 60.0% | 6,896,698 | 6,901,485 |
| 50% | 50.0% | 5,747,249 | 5,745,455 |
| 40% | 40.0% | 4,597,799 | 4,603,028 |
| 30% | 30.0% | 3,448,349 | 3,449,127 |
| 20% | 20.0% | 2,298,899 | 2,304,323 |
| 10% | 10.0% | 1,149,450 | 1,150,674 |
| Active Idle | 0 | 0 | |
| Target Load | Actual Load | ssj_ops | |
|---|---|---|---|
| Target | Actual | ||
| Calibration 1 | 11,518,337 | ||
| Calibration 2 | 11,506,305 | ||
| Calibration 3 | 11,514,556 | ||
| ssj_ops@calibrated=11,510,431 | |||
| 100% | 99.7% | 11,510,431 | 11,472,740 |
| 90% | 90.0% | 10,359,388 | 10,360,188 |
| 80% | 79.9% | 9,208,344 | 9,196,217 |
| 70% | 70.0% | 8,057,301 | 8,054,359 |
| 60% | 59.9% | 6,906,258 | 6,892,343 |
| 50% | 50.0% | 5,755,215 | 5,751,320 |
| 40% | 40.0% | 4,604,172 | 4,600,104 |
| 30% | 30.0% | 3,453,129 | 3,449,770 |
| 20% | 20.0% | 2,302,086 | 2,305,435 |
| 10% | 10.0% | 1,151,043 | 1,147,585 |
| Active Idle | 0 | 0 | |

| Target Load | Actual Load | ssj_ops | |
|---|---|---|---|
| Target | Actual | ||
| Calibration 1 | 11,491,684 | ||
| Calibration 2 | 11,481,027 | ||
| Calibration 3 | 11,493,660 | ||
| ssj_ops@calibrated=11,487,344 | |||
| 100% | 99.7% | 11,487,344 | 11,455,440 |
| 90% | 90.1% | 10,338,609 | 10,346,501 |
| 80% | 80.1% | 9,189,875 | 9,196,519 |
| 70% | 70.0% | 8,041,140 | 8,036,614 |
| 60% | 60.0% | 6,892,406 | 6,890,947 |
| 50% | 50.0% | 5,743,672 | 5,743,633 |
| 40% | 40.0% | 4,594,937 | 4,600,042 |
| 30% | 30.0% | 3,446,203 | 3,445,925 |
| 20% | 20.0% | 2,297,469 | 2,294,550 |
| 10% | 10.0% | 1,148,734 | 1,150,424 |
| Active Idle | 0 | 0 | |
