
SPECpower_ssj2008
Aggregate Performance Report
Copyright © 2007-2010 Standard Performance Evaluation Corporation
| Hewlett-Packard Company ProLiant SL2x170z G6 | ssj_ops@100% = 2,889,017 ssj_ops@100% per Host = 722,254 ssj_ops@100% per JVM = 120,376 |
||||
| Test Sponsor: | Hewlett-Packard Company | SPEC License #: | 3 | Test Method: | Multi Node |
| Tested By: | Hewlett-Packard Company | Test Location: | Houston, TX, USA | Test Date: | Jun 1, 2010 |
| Hardware Availability: | Jun-2010 | Software Availability: | Sep-2009 | Publication: | Jun 17, 2010 |
| System Source: | Single Supplier | System Designation: | Server | Power Provisioning: | Line-powered |
| Target Load | Actual Load | ssj_ops | |
|---|---|---|---|
| Target | Actual | ||
| Calibration 1 | 2,883,238 | ||
| Calibration 2 | 2,898,419 | ||
| Calibration 3 | 2,898,933 | ||
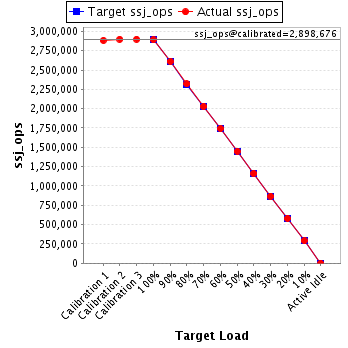
| ssj_ops@calibrated=2,898,676 | |||
| 100% | 99.7% | 2,898,676 | 2,889,017 |
| 90% | 90.1% | 2,608,809 | 2,611,127 |
| 80% | 80.0% | 2,318,941 | 2,319,902 |
| 70% | 70.1% | 2,029,073 | 2,031,265 |
| 60% | 60.1% | 1,739,206 | 1,740,977 |
| 50% | 50.0% | 1,449,338 | 1,448,809 |
| 40% | 40.0% | 1,159,470 | 1,159,755 |
| 30% | 30.0% | 869,603 | 869,077 |
| 20% | 20.0% | 579,735 | 581,126 |
| 10% | 10.0% | 289,868 | 290,762 |
| Active Idle | 0 | 0 | |
| # of Nodes | # of Chips | # of Cores | # of Threads | Total RAM (GB) | # of OS Images | # of JVM Instances |
|---|---|---|---|---|---|---|
| 4 | 8 | 48 | 96 | 64.0 | 4 | 24 |
| Set Identifier: | sut |
| Set Description: | ProLiant SL2x170z G6 |
| # of Identical Nodes: | 4 |
| Comment: | None |
| Hardware per Node | |
|---|---|
| Hardware Vendor: | Hewlett-Packard Company |
| Model: | ProLiant SL2x170z G6 |
| Form Factor: | 1U |
| CPU Name: | Intel Xeon L5640 |
| CPU Characteristics: | Six-Core, 2.27 GHz, 12 MB L3 cache |
| CPU Frequency (MHz): | 2267 |
| CPU(s) Enabled: | 12 cores, 2 chips, 6 cores/chip |
| Hardware Threads: | 24 (2 / core) |
| CPU(s) Orderable: | 1,2 chips |
| Primary Cache: | 32 KB I + 32 KB D on chip per core |
| Secondary Cache: | 256 MB I+D on chip per chip |
| Tertiary Cache: | 12 MB I+D off chip per chip |
| Other Cache: | None |
| Memory Amount (GB): | 16 |
| # and size of DIMM: | 4 x 4096 MB |
| Memory Details: | 4GB PC3L-10600E; slots 1 and 4 are populated on each processor |
| Power Supply Quantity and Rating (W): | None |
| Power Supply Details: | Shared |
| Disk Drive: | 1 x 60GB 3G SATA 2.5in QR MDL SSD, HP part #586585-B21 |
| Disk Controller: | Integrated SATA |
| # and type of Network Interface Cards (NICs) Installed: | 1 x NC362i Dual Port Multifunction Gigabit Server Adapters |
| NICs Enabled in Firmware / OS / Connected: | 2/2/1 |
| Network Speed (Mbit): | 1000 |
| Keyboard: | None |
| Mouse: | None |
| Monitor: | None |
| Optical Drives: | No |
| Other Hardware: | None |
| Software per Node | |
|---|---|
| Power Management: | Power Saver in OS |
| Operating System (OS): | Windows Server 2008, Enterprise Edition |
| OS Version: | R2 |
| Filesystem: | NTFS |
| JVM Vendor: | IBM Corporation |
| JVM Version: | IBM J9 VM (build 2.4, J2RE 1.6.0 IBM J9 2.4 Windows Server 2008 amd64-64 jvmwa660sr5-20090519_35743 (JIT enabled, AOT enabled) |
| JVM Command-line Options: | -Xaggressive -Xcompressedrefs -Xgcpolicy:gencon -Xmn1500m -Xms1900m -Xmx1900m -XlockReservation -Xnoloa -XtlhPrefetch -Xlp |
| JVM Affinity: | start /affinity [0xF, 0xF0, 0xF00, 0xF000, 0xF0000, 0xF00000] |
| JVM Instances: | 6 |
| JVM Initial Heap (MB): | 1900 |
| JVM Maximum Heap (MB): | 1900 |
| JVM Address Bits: | 64 |
| Boot Firmware Version: | O34 04/02/2010 |
| Management Firmware Version: | 4.20 1/13/10 |
| Workload Version: | SSJ 1.2.6 |
| Director Location: | Controller |
| Other Software: | None |
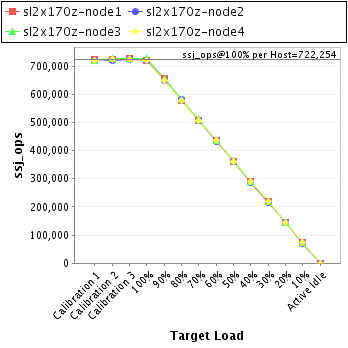
| Host | ssj_ops@100% |
|---|---|
| sl2x170z-node1 | 721,216 |
| sl2x170z-node2 | 719,572 |
| sl2x170z-node3 | 726,994 |
| sl2x170z-node4 | 721,235 |
| ssj_ops@100% | 2,889,017 |
| ssj_ops@100% per Host | 722,254 |
| ssj_ops@100% per JVM | 120,376 |
| Target Load | Actual Load | ssj_ops | |
|---|---|---|---|
| Target | Actual | ||
| Calibration 1 | 723,542 | ||
| Calibration 2 | 725,309 | ||
| Calibration 3 | 725,703 | ||
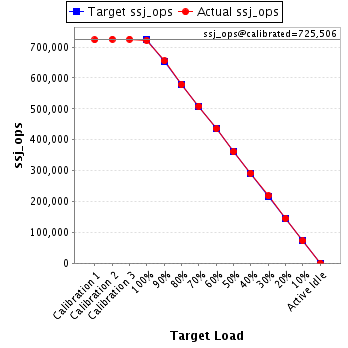
| ssj_ops@calibrated=725,506 | |||
| 100% | 99.4% | 725,506 | 721,216 |
| 90% | 90.3% | 652,955 | 655,048 |
| 80% | 79.7% | 580,405 | 578,507 |
| 70% | 70.1% | 507,854 | 508,776 |
| 60% | 60.1% | 435,304 | 436,071 |
| 50% | 49.8% | 362,753 | 361,123 |
| 40% | 40.2% | 290,202 | 291,797 |
| 30% | 30.0% | 217,652 | 217,926 |
| 20% | 20.1% | 145,101 | 145,536 |
| 10% | 10.0% | 72,551 | 72,600 |
| Active Idle | 0 | 0 | |
| Target Load | Actual Load | ssj_ops | |
|---|---|---|---|
| Target | Actual | ||
| Calibration 1 | 718,926 | ||
| Calibration 2 | 720,857 | ||
| Calibration 3 | 722,200 | ||
| ssj_ops@calibrated=721,529 | |||
| 100% | 99.7% | 721,529 | 719,572 |
| 90% | 90.1% | 649,376 | 650,031 |
| 80% | 80.6% | 577,223 | 581,797 |
| 70% | 70.3% | 505,070 | 507,067 |
| 60% | 59.9% | 432,917 | 431,865 |
| 50% | 50.0% | 360,764 | 360,804 |
| 40% | 39.8% | 288,612 | 287,271 |
| 30% | 29.8% | 216,459 | 215,178 |
| 20% | 20.1% | 144,306 | 145,219 |
| 10% | 9.9% | 72,153 | 71,288 |
| Active Idle | 0 | 0 | |

| Target Load | Actual Load | ssj_ops | |
|---|---|---|---|
| Target | Actual | ||
| Calibration 1 | 721,251 | ||
| Calibration 2 | 728,418 | ||
| Calibration 3 | 726,027 | ||
| ssj_ops@calibrated=727,222 | |||
| 100% | 100.0% | 727,222 | 726,994 |
| 90% | 90.2% | 654,500 | 655,891 |
| 80% | 79.8% | 581,778 | 580,543 |
| 70% | 70.0% | 509,056 | 509,240 |
| 60% | 60.0% | 436,333 | 436,036 |
| 50% | 50.1% | 363,611 | 364,291 |
| 40% | 39.8% | 290,889 | 289,749 |
| 30% | 29.9% | 218,167 | 217,704 |
| 20% | 20.0% | 145,444 | 145,722 |
| 10% | 10.0% | 72,722 | 72,806 |
| Active Idle | 0 | 0 | |

| Target Load | Actual Load | ssj_ops | |
|---|---|---|---|
| Target | Actual | ||
| Calibration 1 | 719,520 | ||
| Calibration 2 | 723,835 | ||
| Calibration 3 | 725,003 | ||
| ssj_ops@calibrated=724,419 | |||
| 100% | 99.6% | 724,419 | 721,235 |
| 90% | 89.7% | 651,977 | 650,156 |
| 80% | 79.9% | 579,535 | 579,055 |
| 70% | 69.9% | 507,093 | 506,182 |
| 60% | 60.3% | 434,652 | 437,005 |
| 50% | 50.1% | 362,210 | 362,591 |
| 40% | 40.2% | 289,768 | 290,938 |
| 30% | 30.1% | 217,326 | 218,270 |
| 20% | 20.0% | 144,884 | 144,649 |
| 10% | 10.2% | 72,442 | 74,067 |
| Active Idle | 0 | 0 | |
