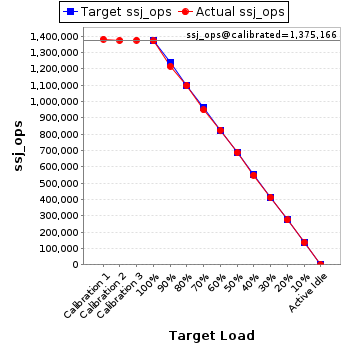
| Target Load |
Actual Load |
ssj_ops |
| Target |
Actual |
| Calibration 1 |
|
|
1,381,844 |
| Calibration 2 |
|
|
1,374,117 |
| Calibration 3 |
|
|
1,376,214 |
| ssj_ops@calibrated=1,375,166 |
| 100% |
99.7% |
1,375,166 |
1,371,159 |
| 90% |
88.4% |
1,237,649 |
1,216,100 |
| 80% |
79.8% |
1,100,133 |
1,097,604 |
| 70% |
69.0% |
962,616 |
948,559 |
| 60% |
60.0% |
825,099 |
824,457 |
| 50% |
50.0% |
687,583 |
686,918 |
| 40% |
39.9% |
550,066 |
548,212 |
| 30% |
30.0% |
412,550 |
412,498 |
| 20% |
19.9% |
275,033 |
274,165 |
| 10% |
9.9% |
137,517 |
136,586 |
| Active Idle |
|
0 |
0 |
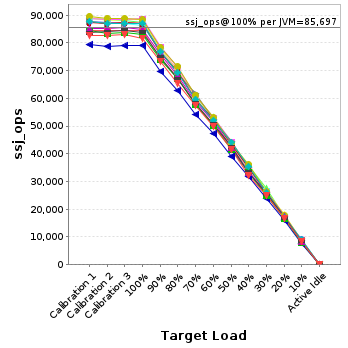
| JVM Instance |
ssj_ops@100% |
| localhost.001 |
84,530 |
| localhost.002 |
86,810 |
| localhost.003 |
87,415 |
| localhost.004 |
88,446 |
| localhost.005 |
88,890 |
| localhost.006 |
86,199 |
| localhost.007 |
87,192 |
| localhost.008 |
86,927 |
| localhost.009 |
87,070 |
| localhost.010 |
79,163 |
| localhost.011 |
82,972 |
| localhost.012 |
88,304 |
| localhost.013 |
84,627 |
| localhost.014 |
87,130 |
| localhost.015 |
83,894 |
| localhost.016 |
81,592 |
| ssj_ops@100% |
1,371,159 |
| ssj_ops@100% per JVM |
85,697 |
JVM 'localhost.001' Scores:
| Target Load |
Actual Load |
ssj_ops |
| Target |
Actual |
| Calibration 1 |
|
|
84,564 |
| Calibration 2 |
|
|
84,298 |
| Calibration 3 |
|
|
84,490 |
| ssj_ops@calibrated=84,394 |
| 100% |
100.2% |
84,394 |
84,530 |
| 90% |
88.1% |
75,955 |
74,352 |
| 80% |
80.0% |
67,515 |
67,514 |
| 70% |
68.5% |
59,076 |
57,798 |
| 60% |
59.7% |
50,637 |
50,388 |
| 50% |
49.9% |
42,197 |
42,145 |
| 40% |
40.6% |
33,758 |
34,226 |
| 30% |
29.4% |
25,318 |
24,828 |
| 20% |
19.8% |
16,879 |
16,718 |
| 10% |
10.2% |
8,439 |
8,596 |
| Active Idle |
|
0 |
0 |
JVM 'localhost.002' Scores:
| Target Load |
Actual Load |
ssj_ops |
| Target |
Actual |
| Calibration 1 |
|
|
87,556 |
| Calibration 2 |
|
|
87,278 |
| Calibration 3 |
|
|
87,267 |
| ssj_ops@calibrated=87,273 |
| 100% |
99.5% |
87,273 |
86,810 |
| 90% |
88.1% |
78,545 |
76,847 |
| 80% |
79.5% |
69,818 |
69,349 |
| 70% |
68.8% |
61,091 |
60,064 |
| 60% |
59.0% |
52,364 |
51,477 |
| 50% |
50.5% |
43,636 |
44,061 |
| 40% |
39.4% |
34,909 |
34,424 |
| 30% |
30.1% |
26,182 |
26,265 |
| 20% |
19.8% |
17,455 |
17,247 |
| 10% |
10.2% |
8,727 |
8,896 |
| Active Idle |
|
0 |
0 |
JVM 'localhost.003' Scores:
| Target Load |
Actual Load |
ssj_ops |
| Target |
Actual |
| Calibration 1 |
|
|
88,896 |
| Calibration 2 |
|
|
88,234 |
| Calibration 3 |
|
|
88,006 |
| ssj_ops@calibrated=88,120 |
| 100% |
99.2% |
88,120 |
87,415 |
| 90% |
88.5% |
79,308 |
77,964 |
| 80% |
79.6% |
70,496 |
70,126 |
| 70% |
68.9% |
61,684 |
60,711 |
| 60% |
60.3% |
52,872 |
53,138 |
| 50% |
49.6% |
44,060 |
43,718 |
| 40% |
40.6% |
35,248 |
35,749 |
| 30% |
31.2% |
26,436 |
27,451 |
| 20% |
19.8% |
17,624 |
17,487 |
| 10% |
9.8% |
8,812 |
8,670 |
| Active Idle |
|
0 |
0 |
JVM 'localhost.004' Scores:
| Target Load |
Actual Load |
ssj_ops |
| Target |
Actual |
| Calibration 1 |
|
|
89,021 |
| Calibration 2 |
|
|
88,178 |
| Calibration 3 |
|
|
88,249 |
| ssj_ops@calibrated=88,213 |
| 100% |
100.3% |
88,213 |
88,446 |
| 90% |
88.6% |
79,392 |
78,129 |
| 80% |
79.5% |
70,571 |
70,155 |
| 70% |
68.8% |
61,749 |
60,679 |
| 60% |
60.2% |
52,928 |
53,103 |
| 50% |
49.4% |
44,107 |
43,588 |
| 40% |
39.7% |
35,285 |
35,048 |
| 30% |
30.0% |
26,464 |
26,463 |
| 20% |
20.5% |
17,643 |
18,107 |
| 10% |
9.9% |
8,821 |
8,748 |
| Active Idle |
|
0 |
0 |
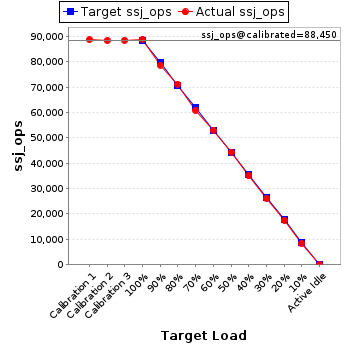
JVM 'localhost.005' Scores:
| Target Load |
Actual Load |
ssj_ops |
| Target |
Actual |
| Calibration 1 |
|
|
88,751 |
| Calibration 2 |
|
|
88,388 |
| Calibration 3 |
|
|
88,512 |
| ssj_ops@calibrated=88,450 |
| 100% |
100.5% |
88,450 |
88,890 |
| 90% |
89.0% |
79,605 |
78,711 |
| 80% |
80.5% |
70,760 |
71,163 |
| 70% |
68.9% |
61,915 |
60,955 |
| 60% |
60.0% |
53,070 |
53,088 |
| 50% |
50.2% |
44,225 |
44,419 |
| 40% |
39.7% |
35,380 |
35,072 |
| 30% |
29.5% |
26,535 |
26,069 |
| 20% |
19.9% |
17,690 |
17,593 |
| 10% |
9.6% |
8,845 |
8,490 |
| Active Idle |
|
0 |
0 |
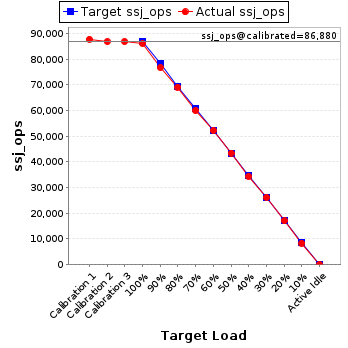
JVM 'localhost.006' Scores:
| Target Load |
Actual Load |
ssj_ops |
| Target |
Actual |
| Calibration 1 |
|
|
87,808 |
| Calibration 2 |
|
|
86,874 |
| Calibration 3 |
|
|
86,887 |
| ssj_ops@calibrated=86,880 |
| 100% |
99.2% |
86,880 |
86,199 |
| 90% |
88.3% |
78,192 |
76,730 |
| 80% |
79.6% |
69,504 |
69,147 |
| 70% |
69.1% |
60,816 |
60,018 |
| 60% |
60.2% |
52,128 |
52,268 |
| 50% |
50.0% |
43,440 |
43,442 |
| 40% |
39.6% |
34,752 |
34,371 |
| 30% |
30.2% |
26,064 |
26,212 |
| 20% |
19.6% |
17,376 |
17,040 |
| 10% |
9.6% |
8,688 |
8,342 |
| Active Idle |
|
0 |
0 |
JVM 'localhost.007' Scores:
| Target Load |
Actual Load |
ssj_ops |
| Target |
Actual |
| Calibration 1 |
|
|
87,718 |
| Calibration 2 |
|
|
87,078 |
| Calibration 3 |
|
|
87,453 |
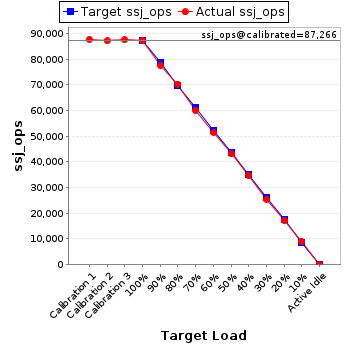
| ssj_ops@calibrated=87,266 |
| 100% |
99.9% |
87,266 |
87,192 |
| 90% |
88.7% |
78,539 |
77,411 |
| 80% |
80.5% |
69,812 |
70,266 |
| 70% |
68.8% |
61,086 |
60,046 |
| 60% |
59.1% |
52,359 |
51,562 |
| 50% |
49.3% |
43,633 |
43,064 |
| 40% |
39.8% |
34,906 |
34,741 |
| 30% |
29.2% |
26,180 |
25,510 |
| 20% |
19.6% |
17,453 |
17,101 |
| 10% |
10.3% |
8,727 |
9,031 |
| Active Idle |
|
0 |
0 |
JVM 'localhost.008' Scores:
| Target Load |
Actual Load |
ssj_ops |
| Target |
Actual |
| Calibration 1 |
|
|
87,714 |
| Calibration 2 |
|
|
87,045 |
| Calibration 3 |
|
|
86,942 |
| ssj_ops@calibrated=86,994 |
| 100% |
99.9% |
86,994 |
86,927 |
| 90% |
88.3% |
78,294 |
76,837 |
| 80% |
79.2% |
69,595 |
68,898 |
| 70% |
70.8% |
60,896 |
61,611 |
| 60% |
60.4% |
52,196 |
52,521 |
| 50% |
51.1% |
43,497 |
44,483 |
| 40% |
40.1% |
34,797 |
34,900 |
| 30% |
30.0% |
26,098 |
26,070 |
| 20% |
20.0% |
17,399 |
17,433 |
| 10% |
10.1% |
8,699 |
8,762 |
| Active Idle |
|
0 |
0 |
JVM 'localhost.009' Scores:
| Target Load |
Actual Load |
ssj_ops |
| Target |
Actual |
| Calibration 1 |
|
|
87,480 |
| Calibration 2 |
|
|
86,882 |
| Calibration 3 |
|
|
87,153 |
| ssj_ops@calibrated=87,017 |
| 100% |
100.1% |
87,017 |
87,070 |
| 90% |
88.0% |
78,315 |
76,599 |
| 80% |
80.1% |
69,614 |
69,721 |
| 70% |
68.6% |
60,912 |
59,678 |
| 60% |
60.1% |
52,210 |
52,266 |
| 50% |
49.7% |
43,509 |
43,209 |
| 40% |
40.2% |
34,807 |
34,980 |
| 30% |
29.9% |
26,105 |
26,057 |
| 20% |
20.1% |
17,403 |
17,521 |
| 10% |
9.8% |
8,702 |
8,516 |
| Active Idle |
|
0 |
0 |
JVM 'localhost.010' Scores:
| Target Load |
Actual Load |
ssj_ops |
| Target |
Actual |
| Calibration 1 |
|
|
79,239 |
| Calibration 2 |
|
|
78,822 |
| Calibration 3 |
|
|
78,903 |
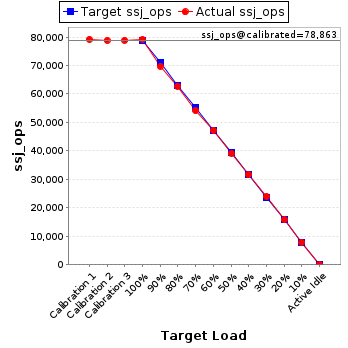
| ssj_ops@calibrated=78,863 |
| 100% |
100.4% |
78,863 |
79,163 |
| 90% |
88.4% |
70,976 |
69,730 |
| 80% |
79.6% |
63,090 |
62,770 |
| 70% |
68.6% |
55,204 |
54,123 |
| 60% |
59.9% |
47,318 |
47,201 |
| 50% |
49.6% |
39,431 |
39,083 |
| 40% |
40.1% |
31,545 |
31,640 |
| 30% |
30.4% |
23,659 |
23,946 |
| 20% |
20.1% |
15,773 |
15,817 |
| 10% |
9.9% |
7,886 |
7,796 |
| Active Idle |
|
0 |
0 |
JVM 'localhost.011' Scores:
| Target Load |
Actual Load |
ssj_ops |
| Target |
Actual |
| Calibration 1 |
|
|
84,433 |
| Calibration 2 |
|
|
83,478 |
| Calibration 3 |
|
|
83,602 |
| ssj_ops@calibrated=83,540 |
| 100% |
99.3% |
83,540 |
82,972 |
| 90% |
88.5% |
75,186 |
73,911 |
| 80% |
80.4% |
66,832 |
67,155 |
| 70% |
69.0% |
58,478 |
57,683 |
| 60% |
60.2% |
50,124 |
50,306 |
| 50% |
49.7% |
41,770 |
41,516 |
| 40% |
39.6% |
33,416 |
33,093 |
| 30% |
29.9% |
25,062 |
24,978 |
| 20% |
20.0% |
16,708 |
16,730 |
| 10% |
9.7% |
8,354 |
8,101 |
| Active Idle |
|
0 |
0 |
JVM 'localhost.012' Scores:
| Target Load |
Actual Load |
ssj_ops |
| Target |
Actual |
| Calibration 1 |
|
|
89,525 |
| Calibration 2 |
|
|
88,847 |
| Calibration 3 |
|
|
88,763 |
| ssj_ops@calibrated=88,805 |
| 100% |
99.4% |
88,805 |
88,304 |
| 90% |
88.3% |
79,925 |
78,385 |
| 80% |
80.4% |
71,044 |
71,434 |
| 70% |
68.9% |
62,164 |
61,183 |
| 60% |
59.7% |
53,283 |
53,015 |
| 50% |
49.3% |
44,403 |
43,798 |
| 40% |
40.6% |
35,522 |
36,062 |
| 30% |
29.7% |
26,642 |
26,400 |
| 20% |
19.9% |
17,761 |
17,704 |
| 10% |
9.7% |
8,881 |
8,571 |
| Active Idle |
|
0 |
0 |
JVM 'localhost.013' Scores:
| Target Load |
Actual Load |
ssj_ops |
| Target |
Actual |
| Calibration 1 |
|
|
85,067 |
| Calibration 2 |
|
|
85,268 |
| Calibration 3 |
|
|
85,477 |
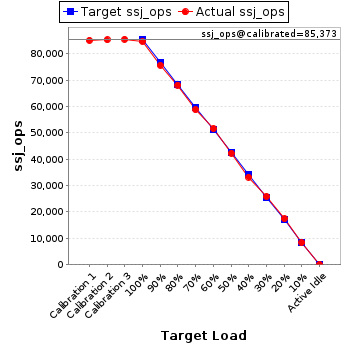
| ssj_ops@calibrated=85,373 |
| 100% |
99.1% |
85,373 |
84,627 |
| 90% |
88.6% |
76,835 |
75,630 |
| 80% |
79.8% |
68,298 |
68,113 |
| 70% |
68.8% |
59,761 |
58,740 |
| 60% |
60.4% |
51,224 |
51,573 |
| 50% |
49.5% |
42,686 |
42,244 |
| 40% |
38.9% |
34,149 |
33,212 |
| 30% |
30.3% |
25,612 |
25,874 |
| 20% |
20.4% |
17,075 |
17,427 |
| 10% |
9.8% |
8,537 |
8,375 |
| Active Idle |
|
0 |
0 |
JVM 'localhost.014' Scores:
| Target Load |
Actual Load |
ssj_ops |
| Target |
Actual |
| Calibration 1 |
|
|
87,829 |
| Calibration 2 |
|
|
86,949 |
| Calibration 3 |
|
|
87,090 |
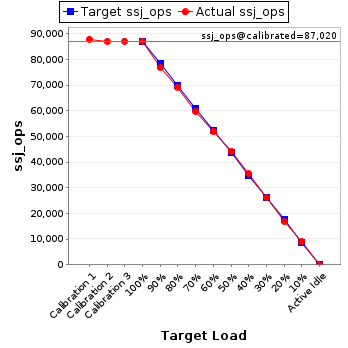
| ssj_ops@calibrated=87,020 |
| 100% |
100.1% |
87,020 |
87,130 |
| 90% |
88.1% |
78,318 |
76,707 |
| 80% |
79.5% |
69,616 |
69,218 |
| 70% |
68.6% |
60,914 |
59,737 |
| 60% |
59.8% |
52,212 |
52,053 |
| 50% |
50.8% |
43,510 |
44,197 |
| 40% |
40.6% |
34,808 |
35,361 |
| 30% |
30.0% |
26,106 |
26,070 |
| 20% |
19.3% |
17,404 |
16,833 |
| 10% |
10.3% |
8,702 |
8,975 |
| Active Idle |
|
0 |
0 |
JVM 'localhost.015' Scores:
| Target Load |
Actual Load |
ssj_ops |
| Target |
Actual |
| Calibration 1 |
|
|
83,546 |
| Calibration 2 |
|
|
83,906 |
| Calibration 3 |
|
|
84,575 |
| ssj_ops@calibrated=84,240 |
| 100% |
99.6% |
84,240 |
83,894 |
| 90% |
88.7% |
75,816 |
74,757 |
| 80% |
79.7% |
67,392 |
67,110 |
| 70% |
69.2% |
58,968 |
58,266 |
| 60% |
60.2% |
50,544 |
50,720 |
| 50% |
50.5% |
42,120 |
42,566 |
| 40% |
39.5% |
33,696 |
33,302 |
| 30% |
30.3% |
25,272 |
25,529 |
| 20% |
20.0% |
16,848 |
16,832 |
| 10% |
10.0% |
8,424 |
8,437 |
| Active Idle |
|
0 |
0 |
JVM 'localhost.016' Scores:
| Target Load |
Actual Load |
ssj_ops |
| Target |
Actual |
| Calibration 1 |
|
|
82,697 |
| Calibration 2 |
|
|
82,591 |
| Calibration 3 |
|
|
82,844 |
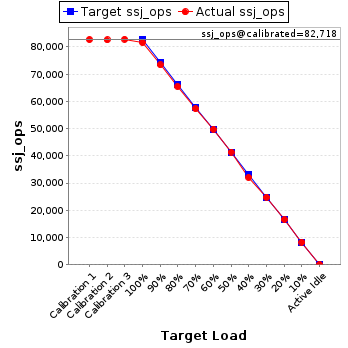
| ssj_ops@calibrated=82,718 |
| 100% |
98.6% |
82,718 |
81,592 |
| 90% |
88.7% |
74,446 |
73,400 |
| 80% |
79.1% |
66,174 |
65,465 |
| 70% |
69.2% |
57,902 |
57,266 |
| 60% |
60.2% |
49,631 |
49,779 |
| 50% |
50.0% |
41,359 |
41,383 |
| 40% |
38.7% |
33,087 |
32,032 |
| 30% |
30.0% |
24,815 |
24,776 |
| 20% |
20.0% |
16,544 |
16,576 |
| 10% |
10.0% |
8,272 |
8,279 |
| Active Idle |
|
0 |
0 |