| Target Load |
Actual Load |
ssj_ops |
| Target |
Actual |
| Calibration 1 |
|
|
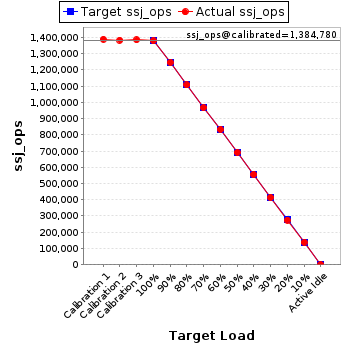
1,389,475 |
| Calibration 2 |
|
|
1,384,132 |
| Calibration 3 |
|
|
1,385,428 |
| ssj_ops@calibrated=1,384,780 |
| 100% |
99.7% |
1,384,780 |
1,380,221 |
| 90% |
90.1% |
1,246,302 |
1,247,325 |
| 80% |
80.0% |
1,107,824 |
1,107,704 |
| 70% |
69.8% |
969,346 |
966,548 |
| 60% |
60.3% |
830,868 |
834,385 |
| 50% |
49.9% |
692,390 |
691,665 |
| 40% |
40.1% |
553,912 |
555,553 |
| 30% |
29.9% |
415,434 |
414,091 |
| 20% |
19.9% |
276,956 |
275,240 |
| 10% |
10.0% |
138,478 |
138,341 |
| Active Idle |
|
0 |
0 |
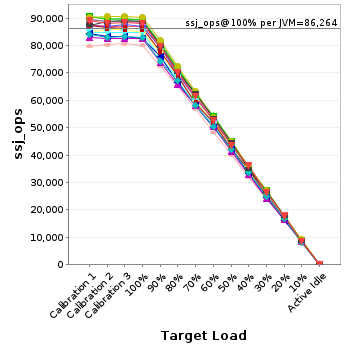
| JVM Instance |
ssj_ops@100% |
| localhost.001 |
86,869 |
| localhost.002 |
87,074 |
| localhost.003 |
89,316 |
| localhost.004 |
84,846 |
| localhost.005 |
88,196 |
| localhost.006 |
84,824 |
| localhost.007 |
80,084 |
| localhost.008 |
88,708 |
| localhost.009 |
86,093 |
| localhost.010 |
82,603 |
| localhost.011 |
89,281 |
| localhost.012 |
90,370 |
| localhost.013 |
82,626 |
| localhost.014 |
82,849 |
| localhost.015 |
88,579 |
| localhost.016 |
87,904 |
| ssj_ops@100% |
1,380,221 |
| ssj_ops@100% per JVM |
86,264 |
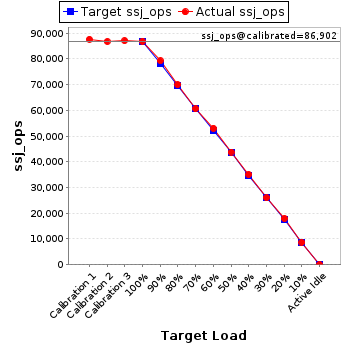
JVM 'localhost.001' Scores:
| Target Load |
Actual Load |
ssj_ops |
| Target |
Actual |
| Calibration 1 |
|
|
87,636 |
| Calibration 2 |
|
|
86,746 |
| Calibration 3 |
|
|
87,058 |
| ssj_ops@calibrated=86,902 |
| 100% |
100.0% |
86,902 |
86,869 |
| 90% |
91.3% |
78,212 |
79,301 |
| 80% |
80.5% |
69,522 |
69,991 |
| 70% |
69.7% |
60,832 |
60,606 |
| 60% |
61.0% |
52,141 |
53,053 |
| 50% |
50.4% |
43,451 |
43,794 |
| 40% |
40.4% |
34,761 |
35,127 |
| 30% |
29.9% |
26,071 |
25,953 |
| 20% |
20.7% |
17,380 |
17,981 |
| 10% |
10.0% |
8,690 |
8,717 |
| Active Idle |
|
0 |
0 |
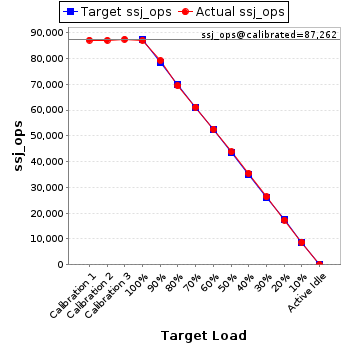
JVM 'localhost.002' Scores:
| Target Load |
Actual Load |
ssj_ops |
| Target |
Actual |
| Calibration 1 |
|
|
87,160 |
| Calibration 2 |
|
|
87,063 |
| Calibration 3 |
|
|
87,460 |
| ssj_ops@calibrated=87,262 |
| 100% |
99.8% |
87,262 |
87,074 |
| 90% |
90.8% |
78,535 |
79,205 |
| 80% |
79.6% |
69,809 |
69,444 |
| 70% |
70.1% |
61,083 |
61,165 |
| 60% |
60.2% |
52,357 |
52,553 |
| 50% |
50.1% |
43,631 |
43,754 |
| 40% |
40.6% |
34,905 |
35,420 |
| 30% |
30.2% |
26,178 |
26,310 |
| 20% |
19.9% |
17,452 |
17,325 |
| 10% |
10.0% |
8,726 |
8,725 |
| Active Idle |
|
0 |
0 |
JVM 'localhost.003' Scores:
| Target Load |
Actual Load |
ssj_ops |
| Target |
Actual |
| Calibration 1 |
|
|
90,493 |
| Calibration 2 |
|
|
89,750 |
| Calibration 3 |
|
|
89,605 |
| ssj_ops@calibrated=89,677 |
| 100% |
99.6% |
89,677 |
89,316 |
| 90% |
88.7% |
80,710 |
79,519 |
| 80% |
79.9% |
71,742 |
71,682 |
| 70% |
69.3% |
62,774 |
62,185 |
| 60% |
60.9% |
53,806 |
54,579 |
| 50% |
50.0% |
44,839 |
44,823 |
| 40% |
40.1% |
35,871 |
35,981 |
| 30% |
30.3% |
26,903 |
27,199 |
| 20% |
19.5% |
17,935 |
17,461 |
| 10% |
10.0% |
8,968 |
8,933 |
| Active Idle |
|
0 |
0 |
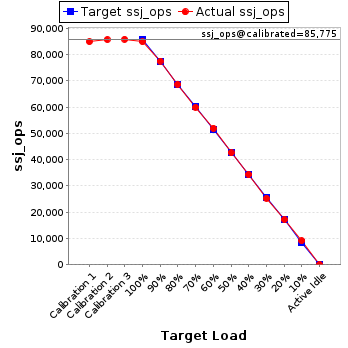
JVM 'localhost.004' Scores:
| Target Load |
Actual Load |
ssj_ops |
| Target |
Actual |
| Calibration 1 |
|
|
84,898 |
| Calibration 2 |
|
|
85,709 |
| Calibration 3 |
|
|
85,841 |
| ssj_ops@calibrated=85,775 |
| 100% |
98.9% |
85,775 |
84,846 |
| 90% |
90.4% |
77,198 |
77,546 |
| 80% |
80.0% |
68,620 |
68,650 |
| 70% |
69.9% |
60,043 |
59,947 |
| 60% |
60.6% |
51,465 |
51,956 |
| 50% |
49.7% |
42,888 |
42,608 |
| 40% |
40.0% |
34,310 |
34,313 |
| 30% |
29.5% |
25,733 |
25,297 |
| 20% |
20.0% |
17,155 |
17,181 |
| 10% |
10.6% |
8,578 |
9,120 |
| Active Idle |
|
0 |
0 |
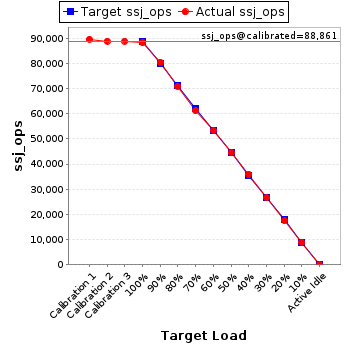
JVM 'localhost.005' Scores:
| Target Load |
Actual Load |
ssj_ops |
| Target |
Actual |
| Calibration 1 |
|
|
89,592 |
| Calibration 2 |
|
|
88,838 |
| Calibration 3 |
|
|
88,885 |
| ssj_ops@calibrated=88,861 |
| 100% |
99.3% |
88,861 |
88,196 |
| 90% |
90.6% |
79,975 |
80,499 |
| 80% |
79.8% |
71,089 |
70,874 |
| 70% |
68.9% |
62,203 |
61,222 |
| 60% |
60.0% |
53,317 |
53,333 |
| 50% |
50.1% |
44,431 |
44,523 |
| 40% |
40.5% |
35,544 |
36,000 |
| 30% |
30.0% |
26,658 |
26,624 |
| 20% |
19.7% |
17,772 |
17,495 |
| 10% |
10.0% |
8,886 |
8,883 |
| Active Idle |
|
0 |
0 |
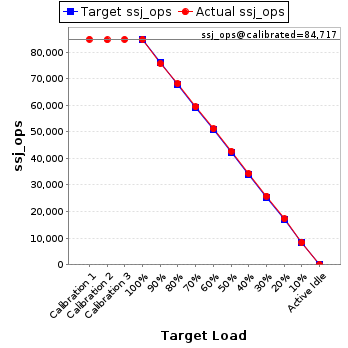
JVM 'localhost.006' Scores:
| Target Load |
Actual Load |
ssj_ops |
| Target |
Actual |
| Calibration 1 |
|
|
84,866 |
| Calibration 2 |
|
|
84,642 |
| Calibration 3 |
|
|
84,791 |
| ssj_ops@calibrated=84,717 |
| 100% |
100.1% |
84,717 |
84,824 |
| 90% |
89.3% |
76,245 |
75,676 |
| 80% |
80.5% |
67,773 |
68,175 |
| 70% |
70.1% |
59,302 |
59,424 |
| 60% |
60.3% |
50,830 |
51,116 |
| 50% |
50.4% |
42,358 |
42,688 |
| 40% |
40.4% |
33,887 |
34,265 |
| 30% |
30.5% |
25,415 |
25,843 |
| 20% |
20.4% |
16,943 |
17,276 |
| 10% |
9.9% |
8,472 |
8,396 |
| Active Idle |
|
0 |
0 |
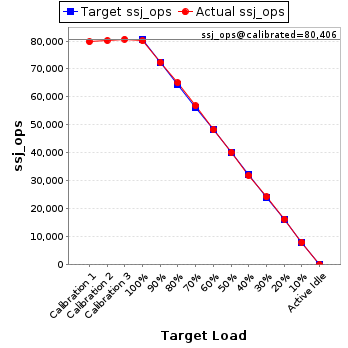
JVM 'localhost.007' Scores:
| Target Load |
Actual Load |
ssj_ops |
| Target |
Actual |
| Calibration 1 |
|
|
79,722 |
| Calibration 2 |
|
|
80,166 |
| Calibration 3 |
|
|
80,646 |
| ssj_ops@calibrated=80,406 |
| 100% |
99.6% |
80,406 |
80,084 |
| 90% |
90.1% |
72,365 |
72,436 |
| 80% |
80.9% |
64,325 |
65,065 |
| 70% |
70.7% |
56,284 |
56,820 |
| 60% |
60.0% |
48,243 |
48,239 |
| 50% |
50.0% |
40,203 |
40,187 |
| 40% |
39.6% |
32,162 |
31,873 |
| 30% |
30.1% |
24,122 |
24,217 |
| 20% |
20.3% |
16,081 |
16,317 |
| 10% |
10.0% |
8,041 |
8,018 |
| Active Idle |
|
0 |
0 |
JVM 'localhost.008' Scores:
| Target Load |
Actual Load |
ssj_ops |
| Target |
Actual |
| Calibration 1 |
|
|
89,384 |
| Calibration 2 |
|
|
88,696 |
| Calibration 3 |
|
|
88,689 |
| ssj_ops@calibrated=88,692 |
| 100% |
100.0% |
88,692 |
88,708 |
| 90% |
89.3% |
79,823 |
79,179 |
| 80% |
79.9% |
70,954 |
70,883 |
| 70% |
70.9% |
62,085 |
62,851 |
| 60% |
60.0% |
53,215 |
53,179 |
| 50% |
49.1% |
44,346 |
43,505 |
| 40% |
40.5% |
35,477 |
35,936 |
| 30% |
29.6% |
26,608 |
26,247 |
| 20% |
19.8% |
17,738 |
17,583 |
| 10% |
10.0% |
8,869 |
8,847 |
| Active Idle |
|
0 |
0 |
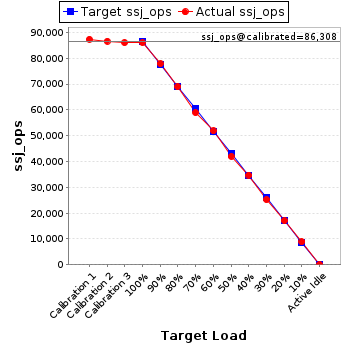
JVM 'localhost.009' Scores:
| Target Load |
Actual Load |
ssj_ops |
| Target |
Actual |
| Calibration 1 |
|
|
87,359 |
| Calibration 2 |
|
|
86,596 |
| Calibration 3 |
|
|
86,019 |
| ssj_ops@calibrated=86,308 |
| 100% |
99.8% |
86,308 |
86,093 |
| 90% |
90.2% |
77,677 |
77,852 |
| 80% |
79.9% |
69,046 |
68,955 |
| 70% |
68.2% |
60,415 |
58,899 |
| 60% |
60.0% |
51,785 |
51,822 |
| 50% |
48.6% |
43,154 |
41,933 |
| 40% |
40.2% |
34,523 |
34,733 |
| 30% |
29.2% |
25,892 |
25,170 |
| 20% |
19.7% |
17,262 |
17,020 |
| 10% |
10.2% |
8,631 |
8,837 |
| Active Idle |
|
0 |
0 |
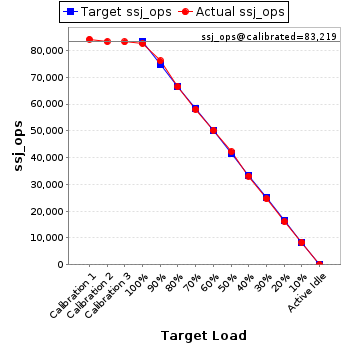
JVM 'localhost.010' Scores:
| Target Load |
Actual Load |
ssj_ops |
| Target |
Actual |
| Calibration 1 |
|
|
84,184 |
| Calibration 2 |
|
|
83,277 |
| Calibration 3 |
|
|
83,161 |
| ssj_ops@calibrated=83,219 |
| 100% |
99.3% |
83,219 |
82,603 |
| 90% |
91.4% |
74,897 |
76,066 |
| 80% |
79.8% |
66,575 |
66,447 |
| 70% |
69.6% |
58,253 |
57,958 |
| 60% |
60.3% |
49,932 |
50,198 |
| 50% |
50.7% |
41,610 |
42,168 |
| 40% |
39.8% |
33,288 |
33,091 |
| 30% |
29.6% |
24,966 |
24,601 |
| 20% |
19.3% |
16,644 |
16,037 |
| 10% |
10.0% |
8,322 |
8,312 |
| Active Idle |
|
0 |
0 |
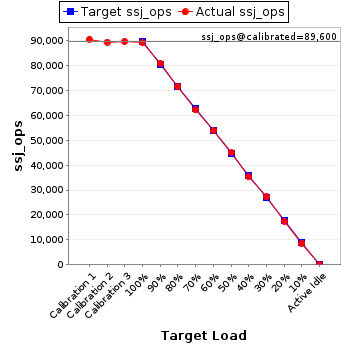
JVM 'localhost.011' Scores:
| Target Load |
Actual Load |
ssj_ops |
| Target |
Actual |
| Calibration 1 |
|
|
90,593 |
| Calibration 2 |
|
|
89,474 |
| Calibration 3 |
|
|
89,726 |
| ssj_ops@calibrated=89,600 |
| 100% |
99.6% |
89,600 |
89,281 |
| 90% |
90.2% |
80,640 |
80,856 |
| 80% |
79.9% |
71,680 |
71,601 |
| 70% |
69.4% |
62,720 |
62,162 |
| 60% |
60.3% |
53,760 |
54,043 |
| 50% |
50.2% |
44,800 |
44,983 |
| 40% |
39.3% |
35,840 |
35,233 |
| 30% |
30.4% |
26,880 |
27,223 |
| 20% |
19.5% |
17,920 |
17,467 |
| 10% |
9.7% |
8,960 |
8,654 |
| Active Idle |
|
0 |
0 |
JVM 'localhost.012' Scores:
| Target Load |
Actual Load |
ssj_ops |
| Target |
Actual |
| Calibration 1 |
|
|
90,213 |
| Calibration 2 |
|
|
90,555 |
| Calibration 3 |
|
|
90,511 |
| ssj_ops@calibrated=90,533 |
| 100% |
99.8% |
90,533 |
90,370 |
| 90% |
90.2% |
81,479 |
81,622 |
| 80% |
80.0% |
72,426 |
72,429 |
| 70% |
69.7% |
63,373 |
63,070 |
| 60% |
59.2% |
54,320 |
53,553 |
| 50% |
49.8% |
45,266 |
45,077 |
| 40% |
39.6% |
36,213 |
35,828 |
| 30% |
29.8% |
27,160 |
26,986 |
| 20% |
19.6% |
18,107 |
17,754 |
| 10% |
10.2% |
9,053 |
9,216 |
| Active Idle |
|
0 |
0 |
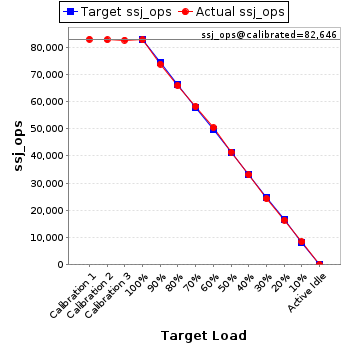
JVM 'localhost.013' Scores:
| Target Load |
Actual Load |
ssj_ops |
| Target |
Actual |
| Calibration 1 |
|
|
82,886 |
| Calibration 2 |
|
|
82,696 |
| Calibration 3 |
|
|
82,596 |
| ssj_ops@calibrated=82,646 |
| 100% |
100.0% |
82,646 |
82,626 |
| 90% |
89.2% |
74,381 |
73,739 |
| 80% |
79.7% |
66,117 |
65,866 |
| 70% |
70.4% |
57,852 |
58,188 |
| 60% |
60.9% |
49,588 |
50,346 |
| 50% |
50.1% |
41,323 |
41,421 |
| 40% |
39.9% |
33,058 |
33,008 |
| 30% |
29.3% |
24,794 |
24,256 |
| 20% |
19.8% |
16,529 |
16,389 |
| 10% |
10.1% |
8,265 |
8,387 |
| Active Idle |
|
0 |
0 |
JVM 'localhost.014' Scores:
| Target Load |
Actual Load |
ssj_ops |
| Target |
Actual |
| Calibration 1 |
|
|
83,968 |
| Calibration 2 |
|
|
83,040 |
| Calibration 3 |
|
|
83,183 |
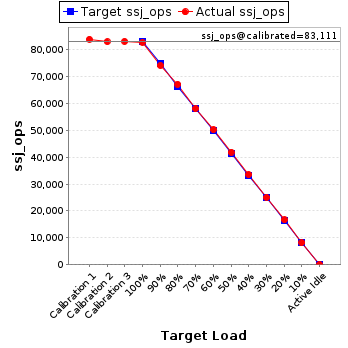
| ssj_ops@calibrated=83,111 |
| 100% |
99.7% |
83,111 |
82,849 |
| 90% |
89.3% |
74,800 |
74,183 |
| 80% |
80.9% |
66,489 |
67,196 |
| 70% |
69.9% |
58,178 |
58,110 |
| 60% |
60.5% |
49,867 |
50,278 |
| 50% |
50.4% |
41,556 |
41,890 |
| 40% |
40.4% |
33,245 |
33,596 |
| 30% |
30.1% |
24,933 |
25,029 |
| 20% |
20.1% |
16,622 |
16,712 |
| 10% |
9.9% |
8,311 |
8,203 |
| Active Idle |
|
0 |
0 |
JVM 'localhost.015' Scores:
| Target Load |
Actual Load |
ssj_ops |
| Target |
Actual |
| Calibration 1 |
|
|
87,357 |
| Calibration 2 |
|
|
88,703 |
| Calibration 3 |
|
|
89,022 |
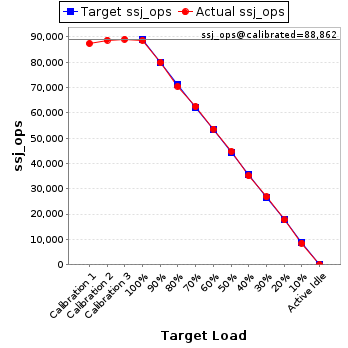
| ssj_ops@calibrated=88,862 |
| 100% |
99.7% |
88,862 |
88,579 |
| 90% |
89.9% |
79,976 |
79,862 |
| 80% |
79.2% |
71,090 |
70,419 |
| 70% |
70.3% |
62,204 |
62,476 |
| 60% |
60.3% |
53,317 |
53,571 |
| 50% |
50.3% |
44,431 |
44,707 |
| 40% |
39.5% |
35,545 |
35,087 |
| 30% |
30.1% |
26,659 |
26,740 |
| 20% |
19.9% |
17,772 |
17,650 |
| 10% |
9.5% |
8,886 |
8,466 |
| Active Idle |
|
0 |
0 |
JVM 'localhost.016' Scores:
| Target Load |
Actual Load |
ssj_ops |
| Target |
Actual |
| Calibration 1 |
|
|
89,164 |
| Calibration 2 |
|
|
88,180 |
| Calibration 3 |
|
|
88,235 |
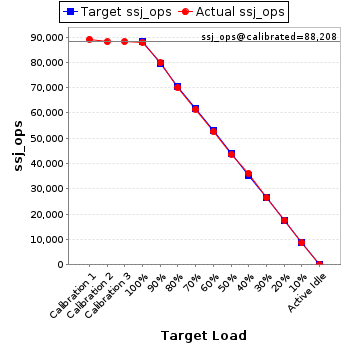
| ssj_ops@calibrated=88,208 |
| 100% |
99.7% |
88,208 |
87,904 |
| 90% |
90.4% |
79,387 |
79,784 |
| 80% |
79.4% |
70,566 |
70,025 |
| 70% |
69.7% |
61,746 |
61,467 |
| 60% |
59.6% |
52,925 |
52,567 |
| 50% |
49.4% |
44,104 |
43,603 |
| 40% |
40.9% |
35,283 |
36,062 |
| 30% |
29.9% |
26,462 |
26,395 |
| 20% |
19.9% |
17,642 |
17,592 |
| 10% |
9.8% |
8,821 |
8,625 |
| Active Idle |
|
0 |
0 |