SPECpower_ssj2008
Host 'WIN-SUT105' Performance Report
Copyright © 2007-2019 Standard Performance Evaluation Corporation
| New H3C Technologies Co., Ltd. H3C UniServer B5700 G3 | ssj_ops@100% = 5,704,210 ssj_ops@100% per JVM = 1,426,053 |
||||
| Test Sponsor: | New H3C Technologies Co., Ltd. | SPEC License #: | 9066 | Test Method: | Multi Node |
| Tested By: | New H3C Technologies Co., Ltd. | Test Location: | Hangzhou, Zhejiang, China | Test Date: | May 15, 2019 |
| Hardware Availability: | Jan-2019 | Software Availability: | Jan-2019 | Publication: | Jun 12, 2019 |
| System Source: | Single Supplier | System Designation: | Server | Power Provisioning: | Line-powered |
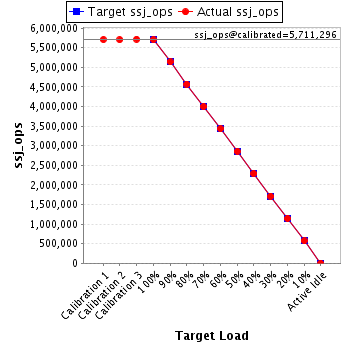
| Target Load | Actual Load | ssj_ops | |
|---|---|---|---|
| Target | Actual | ||
| Calibration 1 | 5,705,594 | ||
| Calibration 2 | 5,704,616 | ||
| Calibration 3 | 5,717,977 | ||
| ssj_ops@calibrated=5,711,296 | |||
| 100% | 99.9% | 5,711,296 | 5,704,210 |
| 90% | 90.0% | 5,140,166 | 5,139,019 |
| 80% | 80.0% | 4,569,037 | 4,570,281 |
| 70% | 70.1% | 3,997,907 | 4,000,789 |
| 60% | 60.0% | 3,426,778 | 3,429,270 |
| 50% | 50.0% | 2,855,648 | 2,856,625 |
| 40% | 40.0% | 2,284,518 | 2,285,040 |
| 30% | 30.0% | 1,713,389 | 1,714,396 |
| 20% | 20.0% | 1,142,259 | 1,142,588 |
| 10% | 10.0% | 571,130 | 570,738 |
| Active Idle | 0 | 0 | |
| Set Identifier: | sut |
| Set Description: | System Under Test |
| # of Identical Nodes: | 10 |
| Comment: | SUT |
| Hardware | |
|---|---|
| Hardware Vendor: | New H3C Technologies Co., Ltd. |
| Model: | H3C UniServer B5700 G3 |
| Form Factor: | Other |
| CPU Name: | Intel Xeon Platinum 8180 2.50GHz |
| CPU Characteristics: | 28-Core, 2.50 GHz, 38.5 MB L3 Cache |
| CPU Frequency (MHz): | 2500 |
| CPU(s) Enabled: | 56 cores, 2 chips, 28 cores/chip |
| Hardware Threads: | 112 (2 / core) |
| CPU(s) Orderable: | 1,2 chips |
| Primary Cache: | 32 KB I + 32 KB D on chip per core |
| Secondary Cache: | 1 MB I+D on chip per core |
| Tertiary Cache: | 39424 KB I+D on chip per chip |
| Other Cache: | None |
| Memory Amount (GB): | 192.0 |
| # and size of DIMM: | 12 x 16384 MB |
| Memory Details: | 12 x 16GB 2Rx8 PC4-2666-V ECC;slots A1, A2, A3, A4, A5, A6, B1, B2, B3, B4, B5, B6 populated |
| Power Supply Quantity and Rating (W): | None |
| Power Supply Details: | Shared |
| Disk Drive: | SATA DOM 128GB P/N DESSH-A28D09BCADCA |
| Disk Controller: | Integrated SATA controller |
| # and type of Network Interface Cards (NICs) Installed: | 1 x Intel I350 Gigabit Ethernet Controller |
| NICs Enabled in Firmware / OS / Connected: | 2/2/1 |
| Network Speed (Mbit): | 1000 |
| Keyboard: | None |
| Mouse: | None |
| Monitor: | None |
| Optical Drives: | No |
| Other Hardware: | None |
| Software | |
|---|---|
| Power Management: | Balanced Mode enabled in OS (see SUT Notes) |
| Operating System (OS): | Microsoft Windows Server 2012 R2 Datacenter |
| OS Version: | Version 6.3 (Build 9600) |
| Filesystem: | NTFS |
| JVM Vendor: | Oracle Corporation |
| JVM Version: | Java HotSpot(TM) 64-Bit Server VM (build 24.80-b11, mixed mode), version 1.7.0_80 |
| JVM Command-line Options: | -server -Xmn19g -Xms21g -Xmx21g -XX:SurvivorRatio=1 -XX:TargetSurvivorRatio=99 -XX:ParallelGCThreads=28 -XX:AllocatePrefetchDistance=256 -XX:AllocatePrefetchLines=4 -XX:LoopUnrollLimit=45 -XX:InitialTenuringThreshold=12 -XX:MaxTenuringThreshold=15 -XX:InlineSmallCode=9000 -XX:MaxInlineSize=270 -XX:FreqInlineSize=6000 -XX:+UseLargePages -XX:+UseParallelOldGC -XX:+AggressiveOpts |
| JVM Affinity: | start /NODE [0,2] /AFFINITY [0xFC0FF00FC0FF];start /NODE [1,3] /AFFINITY [0xFF03F00FF03F] |
| JVM Instances: | 4 |
| JVM Initial Heap (MB): | 21000 |
| JVM Maximum Heap (MB): | 21000 |
| JVM Address Bits: | 64 |
| Boot Firmware Version: | 2.00.25 |
| Management Firmware Version: | UIS-OM 1.00.10 |
| Workload Version: | SSJ 1.2.10 |
| Director Location: | Controller |
| Other Software: | Microsoft Windows KB3021910, clearcompressionflag.exe, KB2919355, KB2932046, KB2959977, KB2937592, KB2938439, KB2934018, KB4056898, patched to this test system in May 6, 2019 |
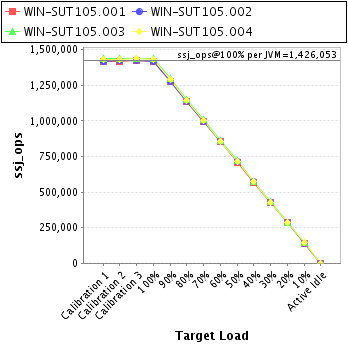
| JVM Instance | ssj_ops@100% |
|---|---|
| WIN-SUT105.001 | 1,417,814 |
| WIN-SUT105.002 | 1,418,457 |
| WIN-SUT105.003 | 1,435,853 |
| WIN-SUT105.004 | 1,432,087 |
| ssj_ops@100% | 5,704,210 |
| ssj_ops@100% per JVM | 1,426,053 |
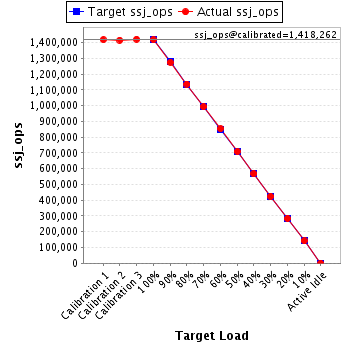
| Target Load | Actual Load | ssj_ops | |
|---|---|---|---|
| Target | Actual | ||
| Calibration 1 | 1,417,400 | ||
| Calibration 2 | 1,415,291 | ||
| Calibration 3 | 1,421,232 | ||
| ssj_ops@calibrated=1,418,262 | |||
| 100% | 100.0% | 1,418,262 | 1,417,814 |
| 90% | 89.8% | 1,276,435 | 1,273,809 |
| 80% | 80.1% | 1,134,609 | 1,136,539 |
| 70% | 70.0% | 992,783 | 992,396 |
| 60% | 60.2% | 850,957 | 853,233 |
| 50% | 50.0% | 709,131 | 708,439 |
| 40% | 40.0% | 567,305 | 567,192 |
| 30% | 29.9% | 425,478 | 424,475 |
| 20% | 20.0% | 283,652 | 283,747 |
| 10% | 10.0% | 141,826 | 141,868 |
| Active Idle | 0 | 0 | |
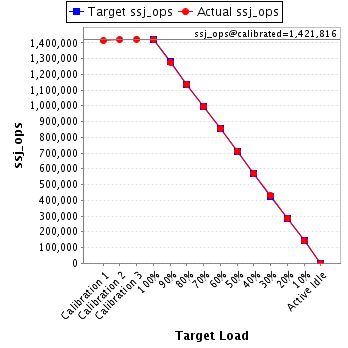
| Target Load | Actual Load | ssj_ops | |
|---|---|---|---|
| Target | Actual | ||
| Calibration 1 | 1,414,923 | ||
| Calibration 2 | 1,420,451 | ||
| Calibration 3 | 1,423,182 | ||
| ssj_ops@calibrated=1,421,816 | |||
| 100% | 99.8% | 1,421,816 | 1,418,457 |
| 90% | 89.9% | 1,279,635 | 1,277,882 |
| 80% | 80.0% | 1,137,453 | 1,138,040 |
| 70% | 70.0% | 995,271 | 995,349 |
| 60% | 60.3% | 853,090 | 856,670 |
| 50% | 50.1% | 710,908 | 712,649 |
| 40% | 40.2% | 568,727 | 571,143 |
| 30% | 30.2% | 426,545 | 429,193 |
| 20% | 20.1% | 284,363 | 285,443 |
| 10% | 10.0% | 142,182 | 141,942 |
| Active Idle | 0 | 0 | |
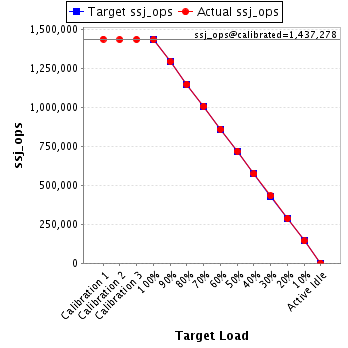
| Target Load | Actual Load | ssj_ops | |
|---|---|---|---|
| Target | Actual | ||
| Calibration 1 | 1,439,751 | ||
| Calibration 2 | 1,436,639 | ||
| Calibration 3 | 1,437,917 | ||
| ssj_ops@calibrated=1,437,278 | |||
| 100% | 99.9% | 1,437,278 | 1,435,853 |
| 90% | 90.1% | 1,293,550 | 1,295,345 |
| 80% | 80.0% | 1,149,822 | 1,149,594 |
| 70% | 70.3% | 1,006,094 | 1,009,695 |
| 60% | 59.9% | 862,367 | 861,256 |
| 50% | 50.1% | 718,639 | 719,556 |
| 40% | 39.9% | 574,911 | 573,882 |
| 30% | 30.1% | 431,183 | 432,470 |
| 20% | 20.0% | 287,456 | 287,319 |
| 10% | 10.0% | 143,728 | 143,696 |
| Active Idle | 0 | 0 | |
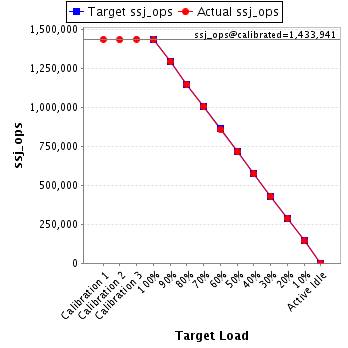
| Target Load | Actual Load | ssj_ops | |
|---|---|---|---|
| Target | Actual | ||
| Calibration 1 | 1,433,520 | ||
| Calibration 2 | 1,432,235 | ||
| Calibration 3 | 1,435,646 | ||
| ssj_ops@calibrated=1,433,941 | |||
| 100% | 99.9% | 1,433,941 | 1,432,087 |
| 90% | 90.1% | 1,290,547 | 1,291,982 |
| 80% | 79.9% | 1,147,152 | 1,146,108 |
| 70% | 70.0% | 1,003,758 | 1,003,349 |
| 60% | 59.8% | 860,364 | 858,110 |
| 50% | 49.9% | 716,970 | 715,981 |
| 40% | 39.9% | 573,576 | 572,823 |
| 30% | 29.9% | 430,182 | 428,258 |
| 20% | 20.0% | 286,788 | 286,080 |
| 10% | 10.0% | 143,394 | 143,232 |
| Active Idle | 0 | 0 | |