SPECpower_ssj2008
Host 'NODE08' Performance Report
Copyright © 2007-2019 Standard Performance Evaluation Corporation
| Hewlett Packard Enterprise Synergy 480 Gen10 Compute Module | ssj_ops@100% = 5,751,003 ssj_ops@100% per JVM = 1,437,751 |
||||
| Test Sponsor: | Hewlett Packard Enterprise | SPEC License #: | 3 | Test Method: | Multi Node |
| Tested By: | Hewlett Packard Enterprise | Test Location: | Houston, TX, USA | Test Date: | Mar 26, 2019 |
| Hardware Availability: | Apr-2019 | Software Availability: | Mar-2019 | Publication: | May 8, 2019 |
| System Source: | Single Supplier | System Designation: | Server | Power Provisioning: | Line-powered |
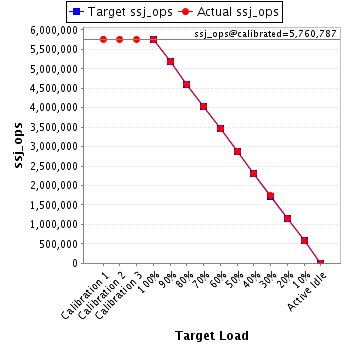
| Target Load | Actual Load | ssj_ops | |
|---|---|---|---|
| Target | Actual | ||
| Calibration 1 | 5,763,441 | ||
| Calibration 2 | 5,759,907 | ||
| Calibration 3 | 5,761,667 | ||
| ssj_ops@calibrated=5,760,787 | |||
| 100% | 99.8% | 5,760,787 | 5,751,003 |
| 90% | 90.0% | 5,184,709 | 5,182,295 |
| 80% | 80.0% | 4,608,630 | 4,606,854 |
| 70% | 70.0% | 4,032,551 | 4,033,732 |
| 60% | 60.0% | 3,456,472 | 3,458,235 |
| 50% | 50.0% | 2,880,394 | 2,879,857 |
| 40% | 40.0% | 2,304,315 | 2,304,134 |
| 30% | 30.1% | 1,728,236 | 1,731,822 |
| 20% | 20.0% | 1,152,157 | 1,150,209 |
| 10% | 10.0% | 576,079 | 574,837 |
| Active Idle | 0 | 0 | |
| Set Identifier: | SUT |
| Set Description: | System Under Test |
| # of Identical Nodes: | 11 |
| Comment: | SUT |
| Hardware | |
|---|---|
| Hardware Vendor: | Hewlett Packard Enterprise |
| Model: | Synergy 480 Gen10 Compute Module |
| Form Factor: | 7U |
| CPU Name: | Intel Xeon Platinum 8280 @ 2.70GHz (Intel Turbo Boost Technology up to 4.00 GHz) |
| CPU Characteristics: | 28-Core, 2.70 GHz, 38.5MB L3 Cache |
| CPU Frequency (MHz): | 2700 |
| CPU(s) Enabled: | 56 cores, 2 chips, 28 cores/chip |
| Hardware Threads: | 112 (2 / core) |
| CPU(s) Orderable: | 1,2 chips |
| Primary Cache: | 32 KB I + 32 KB D on chip per core |
| Secondary Cache: | 1 MB I+D on chip per core |
| Tertiary Cache: | 39424 KB I+D on chip per chip |
| Other Cache: | None |
| Memory Amount (GB): | 192 |
| # and size of DIMM: | 12 x 16384 MB |
| Memory Details: | 12 x 16GB 2Rx8 PC4-2933Y-R; slots 1, 3, 5, 8, 10 and 12 populated in each socket |
| Power Supply Quantity and Rating (W): | None |
| Power Supply Details: | N/A |
| Disk Drive: | 1 x HPE 240GB 6G SATA M.2 SSD (875488-B21) |
| Disk Controller: | HPE Smart Array S100i SR Gen10 |
| # and type of Network Interface Cards (NICs) Installed: | 1 x HPE Synergy 3820C 10/20Gb CNA |
| NICs Enabled in Firmware / OS / Connected: | 2/2/1 |
| Network Speed (Mbit): | 1000 |
| Keyboard: | None |
| Mouse: | None |
| Monitor: | None |
| Optical Drives: | No |
| Other Hardware: | H/S: Standard |
| Software | |
|---|---|
| Power Management: | Enabled (see SUT Notes) |
| Operating System (OS): | Windows Server 2012 R2 Datacenter |
| OS Version: | Version 6.3 (Build 9600) |
| Filesystem: | NTFS |
| JVM Vendor: | Oracle Corporation |
| JVM Version: | Oracle Java HotSpot(TM) 64-Bit Server VM (build 24.80-b11, mixed mode), version 1.7.0_80 |
| JVM Command-line Options: | -server -Xmn21000m -Xms24000m -Xmx24000m -XX:SurvivorRatio=1 -XX:TargetSurvivorRatio=99 -XX:AllocatePrefetchDistance=256 -XX:AllocatePrefetchLines=4 -XX:LoopUnrollLimit=45 -XX:InitialTenuringThreshold=12 -XX:MaxTenuringThreshold=15 -XX:ParallelGCThreads=28 -XX:InlineSmallCode=3900 -XX:MaxInlineSize=270 -XX:FreqInlineSize=2500 -XX:+AggressiveOpts -XX:+UseLargePages -XX:+UseParallelOldGC |
| JVM Affinity: | start /NODE [0,1,2,3] /AFFINITY [0xFFFFFFF] |
| JVM Instances: | 4 |
| JVM Initial Heap (MB): | 24000 |
| JVM Maximum Heap (MB): | 24000 |
| JVM Address Bits: | 64 |
| Boot Firmware Version: | I42 v2.00 (02/02/2019) |
| Management Firmware Version: | 1.40 Feb 05 2019 |
| Workload Version: | SSJ 1.2.10 |
| Director Location: | Controller |
| Other Software: | HPE Service Pack for ProLiant (SPP) Version: 2019.03.0, Microsoft Windows KB4056898, KB4338815 |
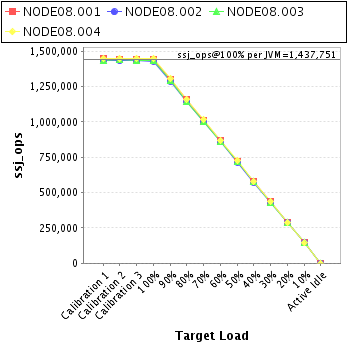
| JVM Instance | ssj_ops@100% |
|---|---|
| NODE08.001 | 1,439,318 |
| NODE08.002 | 1,428,380 |
| NODE08.003 | 1,436,113 |
| NODE08.004 | 1,447,191 |
| ssj_ops@100% | 5,751,003 |
| ssj_ops@100% per JVM | 1,437,751 |
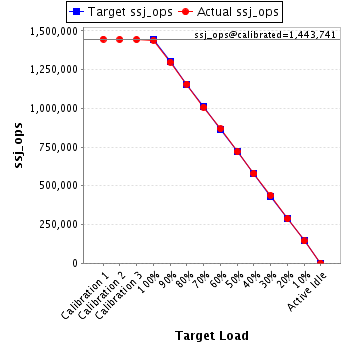
| Target Load | Actual Load | ssj_ops | |
|---|---|---|---|
| Target | Actual | ||
| Calibration 1 | 1,446,246 | ||
| Calibration 2 | 1,444,091 | ||
| Calibration 3 | 1,443,390 | ||
| ssj_ops@calibrated=1,443,741 | |||
| 100% | 99.7% | 1,443,741 | 1,439,318 |
| 90% | 89.9% | 1,299,366 | 1,298,387 |
| 80% | 80.1% | 1,154,992 | 1,156,389 |
| 70% | 69.8% | 1,010,618 | 1,007,572 |
| 60% | 60.1% | 866,244 | 867,281 |
| 50% | 49.8% | 721,870 | 719,693 |
| 40% | 40.0% | 577,496 | 578,208 |
| 30% | 30.3% | 433,122 | 437,077 |
| 20% | 19.9% | 288,748 | 287,367 |
| 10% | 10.0% | 144,374 | 144,030 |
| Active Idle | 0 | 0 | |
| Target Load | Actual Load | ssj_ops | |
|---|---|---|---|
| Target | Actual | ||
| Calibration 1 | 1,433,673 | ||
| Calibration 2 | 1,430,665 | ||
| Calibration 3 | 1,432,169 | ||
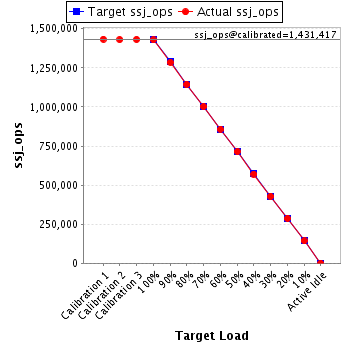
| ssj_ops@calibrated=1,431,417 | |||
| 100% | 99.8% | 1,431,417 | 1,428,380 |
| 90% | 89.8% | 1,288,275 | 1,285,588 |
| 80% | 79.9% | 1,145,134 | 1,144,365 |
| 70% | 70.1% | 1,001,992 | 1,003,282 |
| 60% | 60.0% | 858,850 | 858,648 |
| 50% | 49.9% | 715,708 | 714,250 |
| 40% | 39.9% | 572,567 | 570,905 |
| 30% | 29.9% | 429,425 | 428,700 |
| 20% | 20.1% | 286,283 | 287,018 |
| 10% | 10.0% | 143,142 | 143,290 |
| Active Idle | 0 | 0 | |
| Target Load | Actual Load | ssj_ops | |
|---|---|---|---|
| Target | Actual | ||
| Calibration 1 | 1,434,798 | ||
| Calibration 2 | 1,438,207 | ||
| Calibration 3 | 1,435,945 | ||
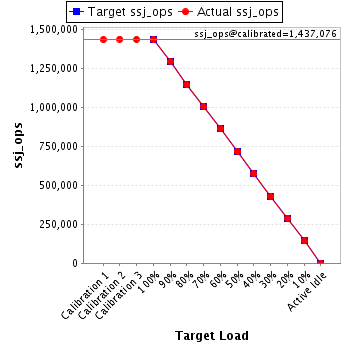
| ssj_ops@calibrated=1,437,076 | |||
| 100% | 99.9% | 1,437,076 | 1,436,113 |
| 90% | 90.0% | 1,293,369 | 1,294,035 |
| 80% | 79.7% | 1,149,661 | 1,145,416 |
| 70% | 69.9% | 1,005,953 | 1,005,086 |
| 60% | 60.1% | 862,246 | 863,604 |
| 50% | 50.0% | 718,538 | 719,165 |
| 40% | 40.1% | 574,830 | 576,024 |
| 30% | 29.9% | 431,123 | 430,300 |
| 20% | 20.0% | 287,415 | 287,304 |
| 10% | 10.0% | 143,708 | 144,025 |
| Active Idle | 0 | 0 | |
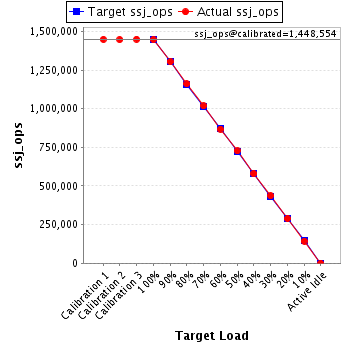
| Target Load | Actual Load | ssj_ops | |
|---|---|---|---|
| Target | Actual | ||
| Calibration 1 | 1,448,724 | ||
| Calibration 2 | 1,446,945 | ||
| Calibration 3 | 1,450,163 | ||
| ssj_ops@calibrated=1,448,554 | |||
| 100% | 99.9% | 1,448,554 | 1,447,191 |
| 90% | 90.0% | 1,303,698 | 1,304,285 |
| 80% | 80.1% | 1,158,843 | 1,160,683 |
| 70% | 70.3% | 1,013,988 | 1,017,793 |
| 60% | 60.0% | 869,132 | 868,702 |
| 50% | 50.2% | 724,277 | 726,748 |
| 40% | 40.0% | 579,422 | 578,997 |
| 30% | 30.1% | 434,566 | 435,744 |
| 20% | 19.9% | 289,711 | 288,520 |
| 10% | 9.9% | 144,855 | 143,493 |
| Active Idle | 0 | 0 | |