SPECpower_ssj2008
Host 'NODE03' Performance Report
Copyright © 2007-2019 Standard Performance Evaluation Corporation
| Hewlett Packard Enterprise Synergy 480 Gen10 Compute Module | ssj_ops@100% = 5,772,636 ssj_ops@100% per JVM = 1,443,159 |
||||
| Test Sponsor: | Hewlett Packard Enterprise | SPEC License #: | 3 | Test Method: | Multi Node |
| Tested By: | Hewlett Packard Enterprise | Test Location: | Houston, TX, USA | Test Date: | Mar 26, 2019 |
| Hardware Availability: | Apr-2019 | Software Availability: | Mar-2019 | Publication: | May 8, 2019 |
| System Source: | Single Supplier | System Designation: | Server | Power Provisioning: | Line-powered |
| Target Load | Actual Load | ssj_ops | |
|---|---|---|---|
| Target | Actual | ||
| Calibration 1 | 5,794,299 | ||
| Calibration 2 | 5,790,476 | ||
| Calibration 3 | 5,791,281 | ||
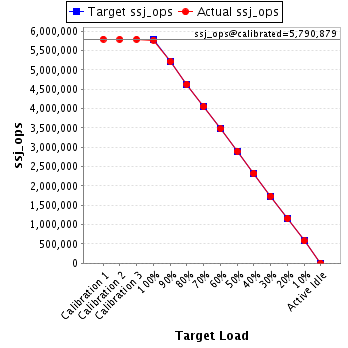
| ssj_ops@calibrated=5,790,879 | |||
| 100% | 99.7% | 5,790,879 | 5,772,636 |
| 90% | 90.1% | 5,211,791 | 5,215,256 |
| 80% | 79.9% | 4,632,703 | 4,625,972 |
| 70% | 70.1% | 4,053,615 | 4,056,747 |
| 60% | 60.0% | 3,474,527 | 3,473,968 |
| 50% | 50.0% | 2,895,439 | 2,895,220 |
| 40% | 40.1% | 2,316,351 | 2,321,793 |
| 30% | 30.0% | 1,737,264 | 1,738,090 |
| 20% | 20.0% | 1,158,176 | 1,160,187 |
| 10% | 10.0% | 579,088 | 578,867 |
| Active Idle | 0 | 0 | |
| Set Identifier: | SUT |
| Set Description: | System Under Test |
| # of Identical Nodes: | 11 |
| Comment: | SUT |
| Hardware | |
|---|---|
| Hardware Vendor: | Hewlett Packard Enterprise |
| Model: | Synergy 480 Gen10 Compute Module |
| Form Factor: | 7U |
| CPU Name: | Intel Xeon Platinum 8280 @ 2.70GHz (Intel Turbo Boost Technology up to 4.00 GHz) |
| CPU Characteristics: | 28-Core, 2.70 GHz, 38.5MB L3 Cache |
| CPU Frequency (MHz): | 2700 |
| CPU(s) Enabled: | 56 cores, 2 chips, 28 cores/chip |
| Hardware Threads: | 112 (2 / core) |
| CPU(s) Orderable: | 1,2 chips |
| Primary Cache: | 32 KB I + 32 KB D on chip per core |
| Secondary Cache: | 1 MB I+D on chip per core |
| Tertiary Cache: | 39424 KB I+D on chip per chip |
| Other Cache: | None |
| Memory Amount (GB): | 192 |
| # and size of DIMM: | 12 x 16384 MB |
| Memory Details: | 12 x 16GB 2Rx8 PC4-2933Y-R; slots 1, 3, 5, 8, 10 and 12 populated in each socket |
| Power Supply Quantity and Rating (W): | None |
| Power Supply Details: | N/A |
| Disk Drive: | 1 x HPE 240GB 6G SATA M.2 SSD (875488-B21) |
| Disk Controller: | HPE Smart Array S100i SR Gen10 |
| # and type of Network Interface Cards (NICs) Installed: | 1 x HPE Synergy 3820C 10/20Gb CNA |
| NICs Enabled in Firmware / OS / Connected: | 2/2/1 |
| Network Speed (Mbit): | 1000 |
| Keyboard: | None |
| Mouse: | None |
| Monitor: | None |
| Optical Drives: | No |
| Other Hardware: | H/S: Standard |
| Software | |
|---|---|
| Power Management: | Enabled (see SUT Notes) |
| Operating System (OS): | Windows Server 2012 R2 Datacenter |
| OS Version: | Version 6.3 (Build 9600) |
| Filesystem: | NTFS |
| JVM Vendor: | Oracle Corporation |
| JVM Version: | Oracle Java HotSpot(TM) 64-Bit Server VM (build 24.80-b11, mixed mode), version 1.7.0_80 |
| JVM Command-line Options: | -server -Xmn21000m -Xms24000m -Xmx24000m -XX:SurvivorRatio=1 -XX:TargetSurvivorRatio=99 -XX:AllocatePrefetchDistance=256 -XX:AllocatePrefetchLines=4 -XX:LoopUnrollLimit=45 -XX:InitialTenuringThreshold=12 -XX:MaxTenuringThreshold=15 -XX:ParallelGCThreads=28 -XX:InlineSmallCode=3900 -XX:MaxInlineSize=270 -XX:FreqInlineSize=2500 -XX:+AggressiveOpts -XX:+UseLargePages -XX:+UseParallelOldGC |
| JVM Affinity: | start /NODE [0,1,2,3] /AFFINITY [0xFFFFFFF] |
| JVM Instances: | 4 |
| JVM Initial Heap (MB): | 24000 |
| JVM Maximum Heap (MB): | 24000 |
| JVM Address Bits: | 64 |
| Boot Firmware Version: | I42 v2.00 (02/02/2019) |
| Management Firmware Version: | 1.40 Feb 05 2019 |
| Workload Version: | SSJ 1.2.10 |
| Director Location: | Controller |
| Other Software: | HPE Service Pack for ProLiant (SPP) Version: 2019.03.0, Microsoft Windows KB4056898, KB4338815 |
| JVM Instance | ssj_ops@100% |
|---|---|
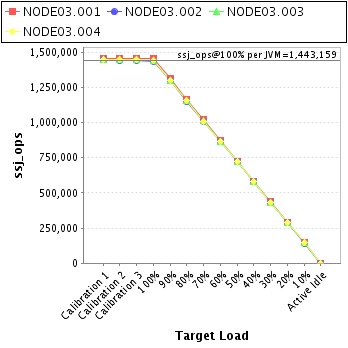
| NODE03.001 | 1,453,799 |
| NODE03.002 | 1,436,841 |
| NODE03.003 | 1,441,021 |
| NODE03.004 | 1,440,975 |
| ssj_ops@100% | 5,772,636 |
| ssj_ops@100% per JVM | 1,443,159 |
| Target Load | Actual Load | ssj_ops | |
|---|---|---|---|
| Target | Actual | ||
| Calibration 1 | 1,457,603 | ||
| Calibration 2 | 1,457,388 | ||
| Calibration 3 | 1,456,173 | ||
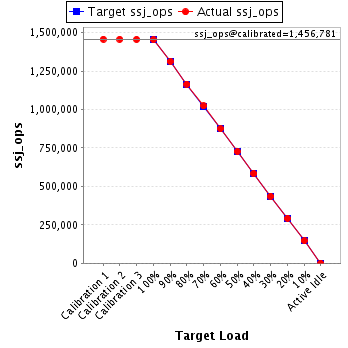
| ssj_ops@calibrated=1,456,781 | |||
| 100% | 99.8% | 1,456,781 | 1,453,799 |
| 90% | 90.1% | 1,311,103 | 1,313,146 |
| 80% | 80.0% | 1,165,425 | 1,164,880 |
| 70% | 70.2% | 1,019,747 | 1,022,960 |
| 60% | 60.0% | 874,068 | 874,394 |
| 50% | 49.9% | 728,390 | 726,768 |
| 40% | 40.0% | 582,712 | 582,709 |
| 30% | 30.0% | 437,034 | 436,929 |
| 20% | 20.1% | 291,356 | 293,107 |
| 10% | 10.0% | 145,678 | 146,084 |
| Active Idle | 0 | 0 | |
| Target Load | Actual Load | ssj_ops | |
|---|---|---|---|
| Target | Actual | ||
| Calibration 1 | 1,445,544 | ||
| Calibration 2 | 1,440,247 | ||
| Calibration 3 | 1,441,962 | ||
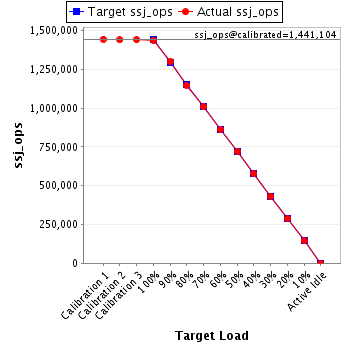
| ssj_ops@calibrated=1,441,104 | |||
| 100% | 99.7% | 1,441,104 | 1,436,841 |
| 90% | 90.2% | 1,296,994 | 1,300,256 |
| 80% | 79.7% | 1,152,883 | 1,148,500 |
| 70% | 70.0% | 1,008,773 | 1,009,238 |
| 60% | 59.9% | 864,662 | 862,807 |
| 50% | 50.0% | 720,552 | 720,860 |
| 40% | 40.1% | 576,442 | 577,610 |
| 30% | 30.0% | 432,331 | 432,785 |
| 20% | 20.0% | 288,221 | 287,795 |
| 10% | 10.0% | 144,110 | 143,951 |
| Active Idle | 0 | 0 | |
| Target Load | Actual Load | ssj_ops | |
|---|---|---|---|
| Target | Actual | ||
| Calibration 1 | 1,445,715 | ||
| Calibration 2 | 1,446,055 | ||
| Calibration 3 | 1,447,956 | ||
| ssj_ops@calibrated=1,447,005 | |||
| 100% | 99.6% | 1,447,005 | 1,441,021 |
| 90% | 89.9% | 1,302,305 | 1,301,150 |
| 80% | 80.0% | 1,157,604 | 1,156,919 |
| 70% | 70.1% | 1,012,904 | 1,014,626 |
| 60% | 60.0% | 868,203 | 868,092 |
| 50% | 50.1% | 723,503 | 724,547 |
| 40% | 40.1% | 578,802 | 580,359 |
| 30% | 30.0% | 434,102 | 434,145 |
| 20% | 20.0% | 289,401 | 289,296 |
| 10% | 10.0% | 144,701 | 144,098 |
| Active Idle | 0 | 0 | |

| Target Load | Actual Load | ssj_ops | |
|---|---|---|---|
| Target | Actual | ||
| Calibration 1 | 1,445,437 | ||
| Calibration 2 | 1,446,786 | ||
| Calibration 3 | 1,445,191 | ||
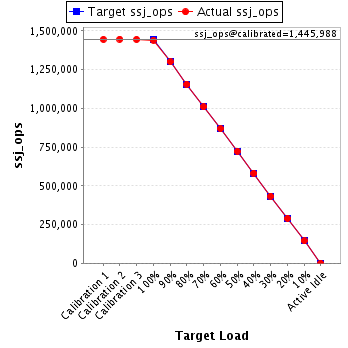
| ssj_ops@calibrated=1,445,988 | |||
| 100% | 99.7% | 1,445,988 | 1,440,975 |
| 90% | 90.0% | 1,301,389 | 1,300,704 |
| 80% | 79.9% | 1,156,791 | 1,155,674 |
| 70% | 69.8% | 1,012,192 | 1,009,923 |
| 60% | 60.1% | 867,593 | 868,676 |
| 50% | 50.0% | 722,994 | 723,045 |
| 40% | 40.2% | 578,395 | 581,114 |
| 30% | 30.0% | 433,796 | 434,231 |
| 20% | 20.1% | 289,198 | 289,989 |
| 10% | 10.0% | 144,599 | 144,734 |
| Active Idle | 0 | 0 | |