
SPECpower_ssj2008
Host 'SY480-01' Performance Report
Copyright © 2007-2019 Standard Performance Evaluation Corporation
| Hewlett Packard Enterprise Synergy 480 Gen10 Compute Module | ssj_ops@100% = 5,964,346 ssj_ops@100% per JVM = 1,491,086 |
||||
| Test Sponsor: | Hewlett Packard Enterprise | SPEC License #: | 3 | Test Method: | Multi Node |
| Tested By: | Hewlett Packard Enterprise | Test Location: | Houston, TX, USA | Test Date: | Mar 12, 2019 |
| Hardware Availability: | Apr-2019 | Software Availability: | Mar-2019 | Publication: | Apr 2, 2019 |
| System Source: | Single Supplier | System Designation: | Server | Power Provisioning: | Line-powered |
| Target Load | Actual Load | ssj_ops | |
|---|---|---|---|
| Target | Actual | ||
| Calibration 1 | 5,991,850 | ||
| Calibration 2 | 5,974,618 | ||
| Calibration 3 | 5,980,818 | ||
| ssj_ops@calibrated=5,977,718 | |||
| 100% | 99.8% | 5,977,718 | 5,964,346 |
| 90% | 89.9% | 5,379,946 | 5,374,025 |
| 80% | 80.1% | 4,782,175 | 4,788,149 |
| 70% | 69.9% | 4,184,403 | 4,178,485 |
| 60% | 60.0% | 3,586,631 | 3,586,892 |
| 50% | 50.0% | 2,988,859 | 2,988,086 |
| 40% | 40.0% | 2,391,087 | 2,390,781 |
| 30% | 30.0% | 1,793,315 | 1,791,395 |
| 20% | 20.1% | 1,195,544 | 1,200,122 |
| 10% | 10.0% | 597,772 | 596,602 |
| Active Idle | 0 | 0 | |

| Set Identifier: | SUT |
| Set Description: | System Under Test |
| # of Identical Nodes: | 7 |
| Comment: | SUT |
| Hardware | |
|---|---|
| Hardware Vendor: | Hewlett Packard Enterprise |
| Model: | Synergy 480 Gen10 Compute Module |
| Form Factor: | blade |
| CPU Name: | Intel Xeon Platinum 8280 @ 2.70GHz |
| CPU Characteristics: | 28-Core, 2.70 GHz, 38.5MB L3 Cache |
| CPU Frequency (MHz): | 2700 |
| CPU(s) Enabled: | 56 cores, 2 chips, 28 cores/chip |
| Hardware Threads: | 112 (2 / core) |
| CPU(s) Orderable: | 1,2 chips |
| Primary Cache: | 32 KB I + 32 KB D on chip per core |
| Secondary Cache: | 1 MB I+D on chip per core |
| Tertiary Cache: | 39424 KB I+D on chip per chip |
| Other Cache: | None |
| Memory Amount (GB): | 192 |
| # and size of DIMM: | 12 x 16384 MB |
| Memory Details: | 12 x 16GB 2Rx8 PC4-2933Y-R; slots 1, 3, 5, 8, 10 and 12 populated on each socket |
| Power Supply Quantity and Rating (W): | None |
| Power Supply Details: | N/A |
| Disk Drive: | 1 x HPE 480GB SATA 6G M.2 2280 (875498-B21) |
| Disk Controller: | HPE Smart Array S100i SR Gen10 |
| # and type of Network Interface Cards (NICs) Installed: | 1 x HPE Synergy 3820C 10/20Gb CNA |
| NICs Enabled in Firmware / OS / Connected: | 2/2/1 |
| Network Speed (Mbit): | 1000 |
| Keyboard: | None |
| Mouse: | None |
| Monitor: | None |
| Optical Drives: | No |
| Other Hardware: | None |
| Software | |
|---|---|
| Power Management: | Enabled (see SUT Notes) |
| Operating System (OS): | SUSE Linux Enterprise Server 12 SP4 |
| OS Version: | 4.12.14-94.41-default |
| Filesystem: | xfs |
| JVM Vendor: | Oracle Corporation |
| JVM Version: | Oracle Java HotSpot(TM) 64-Bit Server VM (build 24.80-b11, mixed mode), version 1.7.0_80 |
| JVM Command-line Options: | -server -Xmn19g -Xms21g -Xmx21g -XX:SurvivorRatio=1 -XX:TargetSurvivorRatio=99 -XX:AllocatePrefetchDistance=384 -XX:AllocatePrefetchLines=4 -XX:LoopUnrollLimit=37 -XX:InitialTenuringThreshold=12 -XX:MaxTenuringThreshold=15 -XX:ParallelGCThreads=28 -XX:InlineSmallCode=3900 -XX:MaxInlineSize=270 -XX:FreqInlineSize=2500 -XX:+AggressiveOpts -XX:+UseLargePages -XX:+UseParallelOldGC |
| JVM Affinity: | numactl --cpunodebind=[0-3] --localalloc |
| JVM Instances: | 4 |
| JVM Initial Heap (MB): | 21000 |
| JVM Maximum Heap (MB): | 21000 |
| JVM Address Bits: | 64 |
| Boot Firmware Version: | I42 v2.00 (02/02/2019) |
| Management Firmware Version: | 1.40 Feb 05 2019 |
| Workload Version: | SSJ 1.2.10 |
| Director Location: | Controller |
| Other Software: | HPE Service Pack for ProLiant (SPP) - Version 2019.03.0 (Mar 2019) |
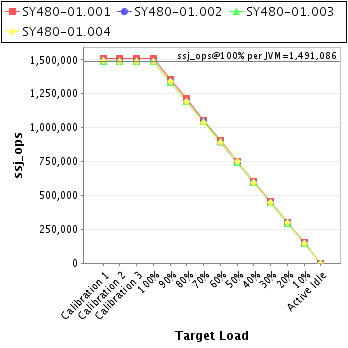
| JVM Instance | ssj_ops@100% |
|---|---|
| SY480-01.001 | 1,507,901 |
| SY480-01.002 | 1,485,398 |
| SY480-01.003 | 1,485,241 |
| SY480-01.004 | 1,485,806 |
| ssj_ops@100% | 5,964,346 |
| ssj_ops@100% per JVM | 1,491,086 |
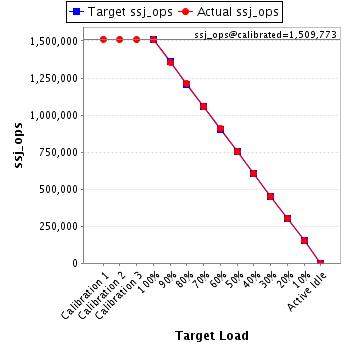
| Target Load | Actual Load | ssj_ops | |
|---|---|---|---|
| Target | Actual | ||
| Calibration 1 | 1,512,270 | ||
| Calibration 2 | 1,510,065 | ||
| Calibration 3 | 1,509,481 | ||
| ssj_ops@calibrated=1,509,773 | |||
| 100% | 99.9% | 1,509,773 | 1,507,901 |
| 90% | 89.8% | 1,358,796 | 1,356,144 |
| 80% | 80.3% | 1,207,818 | 1,212,077 |
| 70% | 69.9% | 1,056,841 | 1,055,107 |
| 60% | 60.1% | 905,864 | 907,671 |
| 50% | 49.8% | 754,887 | 752,137 |
| 40% | 40.0% | 603,909 | 603,577 |
| 30% | 30.0% | 452,932 | 452,430 |
| 20% | 20.1% | 301,955 | 302,717 |
| 10% | 10.0% | 150,977 | 150,914 |
| Active Idle | 0 | 0 | |
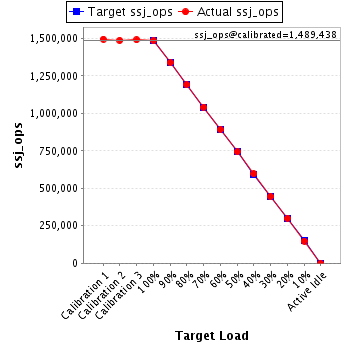
| Target Load | Actual Load | ssj_ops | |
|---|---|---|---|
| Target | Actual | ||
| Calibration 1 | 1,495,801 | ||
| Calibration 2 | 1,487,977 | ||
| Calibration 3 | 1,490,899 | ||
| ssj_ops@calibrated=1,489,438 | |||
| 100% | 99.7% | 1,489,438 | 1,485,398 |
| 90% | 90.0% | 1,340,494 | 1,340,309 |
| 80% | 80.1% | 1,191,550 | 1,192,385 |
| 70% | 70.0% | 1,042,607 | 1,042,978 |
| 60% | 60.0% | 893,663 | 893,672 |
| 50% | 49.9% | 744,719 | 743,491 |
| 40% | 40.1% | 595,775 | 597,464 |
| 30% | 30.0% | 446,831 | 446,802 |
| 20% | 20.2% | 297,888 | 300,796 |
| 10% | 10.0% | 148,944 | 148,419 |
| Active Idle | 0 | 0 | |
| Target Load | Actual Load | ssj_ops | |
|---|---|---|---|
| Target | Actual | ||
| Calibration 1 | 1,490,991 | ||
| Calibration 2 | 1,487,447 | ||
| Calibration 3 | 1,490,270 | ||
| ssj_ops@calibrated=1,488,858 | |||
| 100% | 99.8% | 1,488,858 | 1,485,241 |
| 90% | 89.7% | 1,339,972 | 1,336,083 |
| 80% | 80.1% | 1,191,086 | 1,191,883 |
| 70% | 70.1% | 1,042,201 | 1,043,102 |
| 60% | 60.1% | 893,315 | 894,366 |
| 50% | 49.9% | 744,429 | 743,208 |
| 40% | 40.0% | 595,543 | 596,033 |
| 30% | 29.9% | 446,657 | 445,589 |
| 20% | 19.9% | 297,772 | 296,503 |
| 10% | 10.0% | 148,886 | 148,821 |
| Active Idle | 0 | 0 | |

| Target Load | Actual Load | ssj_ops | |
|---|---|---|---|
| Target | Actual | ||
| Calibration 1 | 1,492,788 | ||
| Calibration 2 | 1,489,129 | ||
| Calibration 3 | 1,490,169 | ||
| ssj_ops@calibrated=1,489,649 | |||
| 100% | 99.7% | 1,489,649 | 1,485,806 |
| 90% | 90.1% | 1,340,684 | 1,341,490 |
| 80% | 80.0% | 1,191,719 | 1,191,804 |
| 70% | 69.6% | 1,042,754 | 1,037,298 |
| 60% | 59.8% | 893,789 | 891,183 |
| 50% | 50.3% | 744,825 | 749,250 |
| 40% | 39.9% | 595,860 | 593,707 |
| 30% | 30.0% | 446,895 | 446,573 |
| 20% | 20.1% | 297,930 | 300,107 |
| 10% | 10.0% | 148,965 | 148,448 |
| Active Idle | 0 | 0 | |
