SPECpower_ssj2008
Host 'SY480-11' Performance Report
Copyright © 2007-2019 Standard Performance Evaluation Corporation
| Hewlett Packard Enterprise Synergy 480 Gen10 Compute Module | ssj_ops@100% = 5,966,118 ssj_ops@100% per JVM = 1,491,530 |
||||
| Test Sponsor: | Hewlett Packard Enterprise | SPEC License #: | 3 | Test Method: | Multi Node |
| Tested By: | Hewlett Packard Enterprise | Test Location: | Houston, TX, USA | Test Date: | Mar 12, 2019 |
| Hardware Availability: | Apr-2019 | Software Availability: | Mar-2019 | Publication: | Apr 2, 2019 |
| System Source: | Single Supplier | System Designation: | Server | Power Provisioning: | Line-powered |
| Target Load | Actual Load | ssj_ops | |
|---|---|---|---|
| Target | Actual | ||
| Calibration 1 | 5,983,620 | ||
| Calibration 2 | 5,968,914 | ||
| Calibration 3 | 5,983,341 | ||
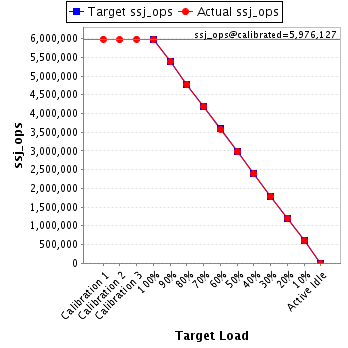
| ssj_ops@calibrated=5,976,127 | |||
| 100% | 99.8% | 5,976,127 | 5,966,118 |
| 90% | 90.1% | 5,378,515 | 5,382,465 |
| 80% | 80.0% | 4,780,902 | 4,780,613 |
| 70% | 70.0% | 4,183,289 | 4,185,166 |
| 60% | 59.9% | 3,585,676 | 3,580,351 |
| 50% | 50.0% | 2,988,064 | 2,988,242 |
| 40% | 40.0% | 2,390,451 | 2,392,050 |
| 30% | 29.9% | 1,792,838 | 1,789,538 |
| 20% | 20.1% | 1,195,225 | 1,198,323 |
| 10% | 10.0% | 597,613 | 596,099 |
| Active Idle | 0 | 0 | |
| Set Identifier: | SUT |
| Set Description: | System Under Test |
| # of Identical Nodes: | 11 |
| Comment: | SUT |
| Hardware | |
|---|---|
| Hardware Vendor: | Hewlett Packard Enterprise |
| Model: | Synergy 480 Gen10 Compute Module |
| Form Factor: | blade |
| CPU Name: | Intel Xeon Platinum 8280 @ 2.70GHz |
| CPU Characteristics: | 28-Core, 2.70 GHz, 38.5MB L3 Cache |
| CPU Frequency (MHz): | 2700 |
| CPU(s) Enabled: | 56 cores, 2 chips, 28 cores/chip |
| Hardware Threads: | 112 (2 / core) |
| CPU(s) Orderable: | 1,2 chips |
| Primary Cache: | 32 KB I + 32 KB D on chip per core |
| Secondary Cache: | 1 MB I+D on chip per core |
| Tertiary Cache: | 39424 KB I+D on chip per chip |
| Other Cache: | None |
| Memory Amount (GB): | 192 |
| # and size of DIMM: | 12 x 16384 MB |
| Memory Details: | 12 x 16GB 2Rx8 PC4-2933Y-R; slots 1, 3, 5, 8, 10 and 12 populated on each socket |
| Power Supply Quantity and Rating (W): | None |
| Power Supply Details: | N/A |
| Disk Drive: | 1 x HPE 480GB SATA 6G M.2 2280 (875498-B21) |
| Disk Controller: | HPE Smart Array S100i SR Gen10 |
| # and type of Network Interface Cards (NICs) Installed: | 1 x HPE Synergy 3820C 10/20Gb CNA |
| NICs Enabled in Firmware / OS / Connected: | 2/2/1 |
| Network Speed (Mbit): | 1000 |
| Keyboard: | None |
| Mouse: | None |
| Monitor: | None |
| Optical Drives: | No |
| Other Hardware: | None |
| Software | |
|---|---|
| Power Management: | Enabled (see SUT Notes) |
| Operating System (OS): | SUSE Linux Enterprise Server 12 SP4 |
| OS Version: | 4.12.14-94.41-default |
| Filesystem: | xfs |
| JVM Vendor: | Oracle Corporation |
| JVM Version: | Oracle Java HotSpot(TM) 64-Bit Server VM (build 24.80-b11, mixed mode), version 1.7.0_80 |
| JVM Command-line Options: | -server -Xmn19g -Xms21g -Xmx21g -XX:SurvivorRatio=1 -XX:TargetSurvivorRatio=99 -XX:AllocatePrefetchDistance=384 -XX:AllocatePrefetchLines=4 -XX:LoopUnrollLimit=37 -XX:InitialTenuringThreshold=12 -XX:MaxTenuringThreshold=15 -XX:ParallelGCThreads=28 -XX:InlineSmallCode=3900 -XX:MaxInlineSize=270 -XX:FreqInlineSize=2500 -XX:+AggressiveOpts -XX:+UseLargePages -XX:+UseParallelOldGC |
| JVM Affinity: | numactl --cpunodebind=[0-3] --localalloc |
| JVM Instances: | 4 |
| JVM Initial Heap (MB): | 21000 |
| JVM Maximum Heap (MB): | 21000 |
| JVM Address Bits: | 64 |
| Boot Firmware Version: | I42 v2.00 (02/02/2019) |
| Management Firmware Version: | 1.40 Feb 05 2019 |
| Workload Version: | SSJ 1.2.10 |
| Director Location: | Controller |
| Other Software: | HPE Service Pack for ProLiant (SPP) - Version 2019.03.0 (Mar 2019) |
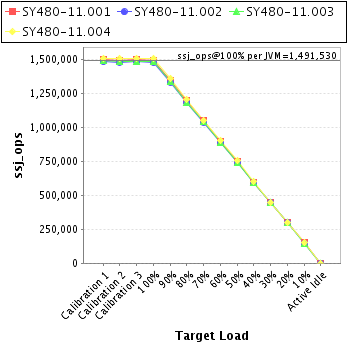
| JVM Instance | ssj_ops@100% |
|---|---|
| SY480-11.001 | 1,493,765 |
| SY480-11.002 | 1,478,948 |
| SY480-11.003 | 1,485,712 |
| SY480-11.004 | 1,507,694 |
| ssj_ops@100% | 5,966,118 |
| ssj_ops@100% per JVM | 1,491,530 |
| Target Load | Actual Load | ssj_ops | |
|---|---|---|---|
| Target | Actual | ||
| Calibration 1 | 1,498,721 | ||
| Calibration 2 | 1,495,540 | ||
| Calibration 3 | 1,498,937 | ||
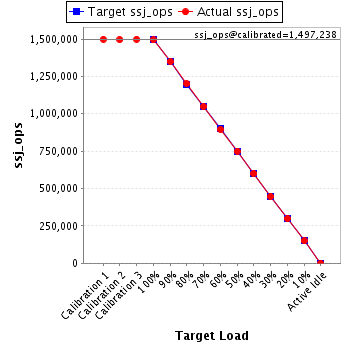
| ssj_ops@calibrated=1,497,238 | |||
| 100% | 99.8% | 1,497,238 | 1,493,765 |
| 90% | 90.1% | 1,347,515 | 1,348,860 |
| 80% | 80.2% | 1,197,791 | 1,201,293 |
| 70% | 70.1% | 1,048,067 | 1,048,847 |
| 60% | 59.8% | 898,343 | 895,155 |
| 50% | 50.1% | 748,619 | 750,090 |
| 40% | 40.0% | 598,895 | 598,689 |
| 30% | 29.8% | 449,172 | 446,111 |
| 20% | 20.0% | 299,448 | 298,795 |
| 10% | 10.0% | 149,724 | 149,855 |
| Active Idle | 0 | 0 | |
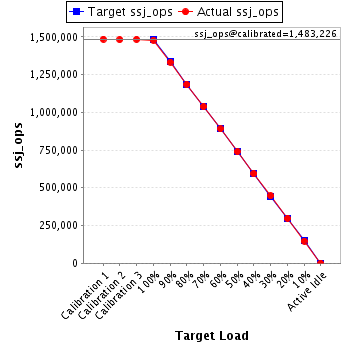
| Target Load | Actual Load | ssj_ops | |
|---|---|---|---|
| Target | Actual | ||
| Calibration 1 | 1,484,895 | ||
| Calibration 2 | 1,482,171 | ||
| Calibration 3 | 1,484,281 | ||
| ssj_ops@calibrated=1,483,226 | |||
| 100% | 99.7% | 1,483,226 | 1,478,948 |
| 90% | 89.9% | 1,334,903 | 1,332,961 |
| 80% | 79.9% | 1,186,581 | 1,185,639 |
| 70% | 70.0% | 1,038,258 | 1,038,717 |
| 60% | 60.0% | 889,936 | 889,980 |
| 50% | 49.9% | 741,613 | 740,121 |
| 40% | 40.0% | 593,290 | 593,466 |
| 30% | 30.1% | 444,968 | 446,361 |
| 20% | 20.1% | 296,645 | 298,646 |
| 10% | 9.9% | 148,323 | 147,424 |
| Active Idle | 0 | 0 | |
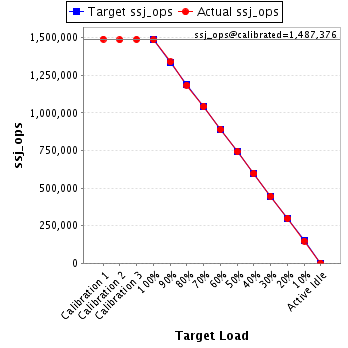
| Target Load | Actual Load | ssj_ops | |
|---|---|---|---|
| Target | Actual | ||
| Calibration 1 | 1,490,563 | ||
| Calibration 2 | 1,485,678 | ||
| Calibration 3 | 1,489,075 | ||
| ssj_ops@calibrated=1,487,376 | |||
| 100% | 99.9% | 1,487,376 | 1,485,712 |
| 90% | 90.0% | 1,338,639 | 1,338,859 |
| 80% | 79.7% | 1,189,901 | 1,185,086 |
| 70% | 70.1% | 1,041,163 | 1,042,854 |
| 60% | 59.9% | 892,426 | 890,742 |
| 50% | 49.9% | 743,688 | 742,664 |
| 40% | 40.1% | 594,951 | 596,307 |
| 30% | 30.0% | 446,213 | 446,510 |
| 20% | 20.1% | 297,475 | 298,691 |
| 10% | 9.9% | 148,738 | 147,949 |
| Active Idle | 0 | 0 | |
| Target Load | Actual Load | ssj_ops | |
|---|---|---|---|
| Target | Actual | ||
| Calibration 1 | 1,509,442 | ||
| Calibration 2 | 1,505,526 | ||
| Calibration 3 | 1,511,048 | ||
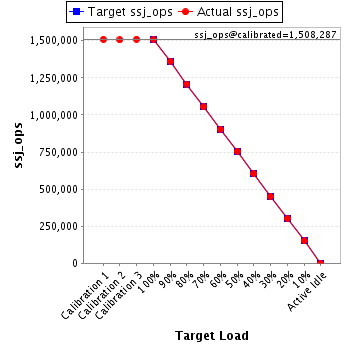
| ssj_ops@calibrated=1,508,287 | |||
| 100% | 100.0% | 1,508,287 | 1,507,694 |
| 90% | 90.3% | 1,357,458 | 1,361,785 |
| 80% | 80.1% | 1,206,629 | 1,208,596 |
| 70% | 69.9% | 1,055,801 | 1,054,749 |
| 60% | 60.0% | 904,972 | 904,474 |
| 50% | 50.1% | 754,143 | 755,368 |
| 40% | 40.0% | 603,315 | 603,588 |
| 30% | 29.9% | 452,486 | 450,555 |
| 20% | 20.0% | 301,657 | 302,191 |
| 10% | 10.0% | 150,829 | 150,870 |
| Active Idle | 0 | 0 | |