
SPECpower_ssj2008
Host 'SY480-09' Performance Report
Copyright © 2007-2019 Standard Performance Evaluation Corporation
| Hewlett Packard Enterprise Synergy 480 Gen10 Compute Module | ssj_ops@100% = 5,929,212 ssj_ops@100% per JVM = 1,482,303 |
||||
| Test Sponsor: | Hewlett Packard Enterprise | SPEC License #: | 3 | Test Method: | Multi Node |
| Tested By: | Hewlett Packard Enterprise | Test Location: | Houston, TX, USA | Test Date: | Mar 12, 2019 |
| Hardware Availability: | Apr-2019 | Software Availability: | Mar-2019 | Publication: | Apr 2, 2019 |
| System Source: | Single Supplier | System Designation: | Server | Power Provisioning: | Line-powered |
| Target Load | Actual Load | ssj_ops | |
|---|---|---|---|
| Target | Actual | ||
| Calibration 1 | 5,957,018 | ||
| Calibration 2 | 5,942,314 | ||
| Calibration 3 | 5,957,808 | ||
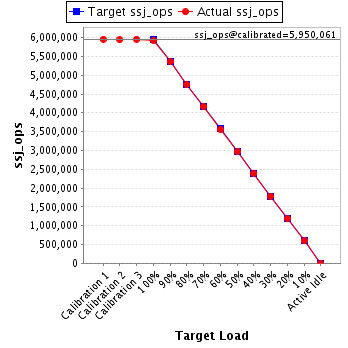
| ssj_ops@calibrated=5,950,061 | |||
| 100% | 99.6% | 5,950,061 | 5,929,212 |
| 90% | 90.0% | 5,355,055 | 5,357,408 |
| 80% | 79.8% | 4,760,049 | 4,751,064 |
| 70% | 70.2% | 4,165,043 | 4,173,969 |
| 60% | 59.9% | 3,570,037 | 3,564,314 |
| 50% | 49.9% | 2,975,031 | 2,971,611 |
| 40% | 40.1% | 2,380,024 | 2,385,599 |
| 30% | 30.0% | 1,785,018 | 1,785,558 |
| 20% | 20.0% | 1,190,012 | 1,188,916 |
| 10% | 10.0% | 595,006 | 594,291 |
| Active Idle | 0 | 0 | |
| Set Identifier: | SUT |
| Set Description: | System Under Test |
| # of Identical Nodes: | 11 |
| Comment: | SUT |
| Hardware | |
|---|---|
| Hardware Vendor: | Hewlett Packard Enterprise |
| Model: | Synergy 480 Gen10 Compute Module |
| Form Factor: | blade |
| CPU Name: | Intel Xeon Platinum 8280 @ 2.70GHz |
| CPU Characteristics: | 28-Core, 2.70 GHz, 38.5MB L3 Cache |
| CPU Frequency (MHz): | 2700 |
| CPU(s) Enabled: | 56 cores, 2 chips, 28 cores/chip |
| Hardware Threads: | 112 (2 / core) |
| CPU(s) Orderable: | 1,2 chips |
| Primary Cache: | 32 KB I + 32 KB D on chip per core |
| Secondary Cache: | 1 MB I+D on chip per core |
| Tertiary Cache: | 39424 KB I+D on chip per chip |
| Other Cache: | None |
| Memory Amount (GB): | 192 |
| # and size of DIMM: | 12 x 16384 MB |
| Memory Details: | 12 x 16GB 2Rx8 PC4-2933Y-R; slots 1, 3, 5, 8, 10 and 12 populated on each socket |
| Power Supply Quantity and Rating (W): | None |
| Power Supply Details: | N/A |
| Disk Drive: | 1 x HPE 480GB SATA 6G M.2 2280 (875498-B21) |
| Disk Controller: | HPE Smart Array S100i SR Gen10 |
| # and type of Network Interface Cards (NICs) Installed: | 1 x HPE Synergy 3820C 10/20Gb CNA |
| NICs Enabled in Firmware / OS / Connected: | 2/2/1 |
| Network Speed (Mbit): | 1000 |
| Keyboard: | None |
| Mouse: | None |
| Monitor: | None |
| Optical Drives: | No |
| Other Hardware: | None |
| Software | |
|---|---|
| Power Management: | Enabled (see SUT Notes) |
| Operating System (OS): | SUSE Linux Enterprise Server 12 SP4 |
| OS Version: | 4.12.14-94.41-default |
| Filesystem: | xfs |
| JVM Vendor: | Oracle Corporation |
| JVM Version: | Oracle Java HotSpot(TM) 64-Bit Server VM (build 24.80-b11, mixed mode), version 1.7.0_80 |
| JVM Command-line Options: | -server -Xmn19g -Xms21g -Xmx21g -XX:SurvivorRatio=1 -XX:TargetSurvivorRatio=99 -XX:AllocatePrefetchDistance=384 -XX:AllocatePrefetchLines=4 -XX:LoopUnrollLimit=37 -XX:InitialTenuringThreshold=12 -XX:MaxTenuringThreshold=15 -XX:ParallelGCThreads=28 -XX:InlineSmallCode=3900 -XX:MaxInlineSize=270 -XX:FreqInlineSize=2500 -XX:+AggressiveOpts -XX:+UseLargePages -XX:+UseParallelOldGC |
| JVM Affinity: | numactl --cpunodebind=[0-3] --localalloc |
| JVM Instances: | 4 |
| JVM Initial Heap (MB): | 21000 |
| JVM Maximum Heap (MB): | 21000 |
| JVM Address Bits: | 64 |
| Boot Firmware Version: | I42 v2.00 (02/02/2019) |
| Management Firmware Version: | 1.40 Feb 05 2019 |
| Workload Version: | SSJ 1.2.10 |
| Director Location: | Controller |
| Other Software: | HPE Service Pack for ProLiant (SPP) - Version 2019.03.0 (Mar 2019) |
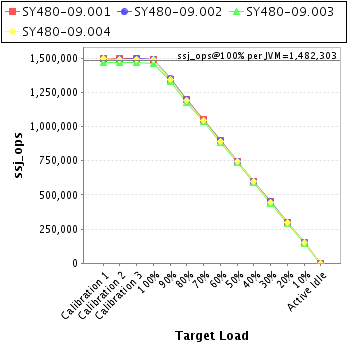
| JVM Instance | ssj_ops@100% |
|---|---|
| SY480-09.001 | 1,490,606 |
| SY480-09.002 | 1,492,624 |
| SY480-09.003 | 1,460,257 |
| SY480-09.004 | 1,485,726 |
| ssj_ops@100% | 5,929,212 |
| ssj_ops@100% per JVM | 1,482,303 |
| Target Load | Actual Load | ssj_ops | |
|---|---|---|---|
| Target | Actual | ||
| Calibration 1 | 1,498,706 | ||
| Calibration 2 | 1,493,348 | ||
| Calibration 3 | 1,497,248 | ||
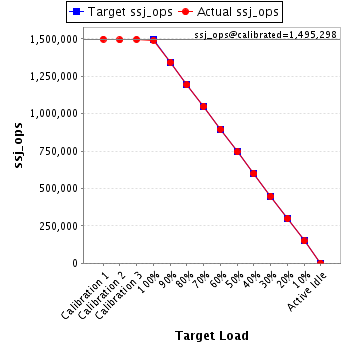
| ssj_ops@calibrated=1,495,298 | |||
| 100% | 99.7% | 1,495,298 | 1,490,606 |
| 90% | 89.9% | 1,345,769 | 1,344,390 |
| 80% | 79.8% | 1,196,239 | 1,193,426 |
| 70% | 70.2% | 1,046,709 | 1,049,312 |
| 60% | 60.0% | 897,179 | 896,683 |
| 50% | 49.8% | 747,649 | 745,099 |
| 40% | 40.1% | 598,119 | 598,994 |
| 30% | 30.0% | 448,590 | 448,900 |
| 20% | 19.9% | 299,060 | 298,157 |
| 10% | 10.0% | 149,530 | 148,909 |
| Active Idle | 0 | 0 | |
| Target Load | Actual Load | ssj_ops | |
|---|---|---|---|
| Target | Actual | ||
| Calibration 1 | 1,495,472 | ||
| Calibration 2 | 1,491,667 | ||
| Calibration 3 | 1,497,742 | ||
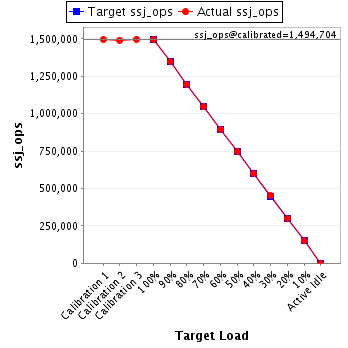
| ssj_ops@calibrated=1,494,704 | |||
| 100% | 99.9% | 1,494,704 | 1,492,624 |
| 90% | 90.1% | 1,345,234 | 1,347,260 |
| 80% | 79.9% | 1,195,764 | 1,194,717 |
| 70% | 69.9% | 1,046,293 | 1,044,724 |
| 60% | 59.9% | 896,823 | 894,682 |
| 50% | 50.0% | 747,352 | 746,845 |
| 40% | 40.0% | 597,882 | 598,056 |
| 30% | 30.2% | 448,411 | 450,817 |
| 20% | 20.0% | 298,941 | 299,609 |
| 10% | 10.0% | 149,470 | 149,314 |
| Active Idle | 0 | 0 | |
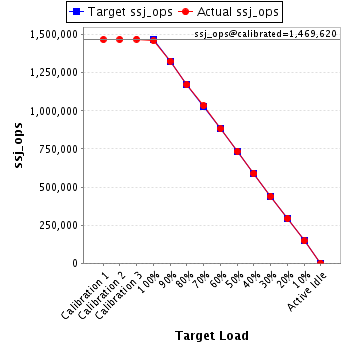
| Target Load | Actual Load | ssj_ops | |
|---|---|---|---|
| Target | Actual | ||
| Calibration 1 | 1,467,748 | ||
| Calibration 2 | 1,468,716 | ||
| Calibration 3 | 1,470,525 | ||
| ssj_ops@calibrated=1,469,620 | |||
| 100% | 99.4% | 1,469,620 | 1,460,257 |
| 90% | 90.2% | 1,322,658 | 1,326,251 |
| 80% | 79.7% | 1,175,696 | 1,171,733 |
| 70% | 70.4% | 1,028,734 | 1,034,102 |
| 60% | 60.0% | 881,772 | 881,934 |
| 50% | 50.0% | 734,810 | 734,113 |
| 40% | 40.0% | 587,848 | 588,285 |
| 30% | 29.9% | 440,886 | 439,589 |
| 20% | 20.0% | 293,924 | 293,564 |
| 10% | 10.0% | 146,962 | 147,264 |
| Active Idle | 0 | 0 | |
| Target Load | Actual Load | ssj_ops | |
|---|---|---|---|
| Target | Actual | ||
| Calibration 1 | 1,495,092 | ||
| Calibration 2 | 1,488,583 | ||
| Calibration 3 | 1,492,293 | ||
| ssj_ops@calibrated=1,490,438 | |||
| 100% | 99.7% | 1,490,438 | 1,485,726 |
| 90% | 89.9% | 1,341,394 | 1,339,506 |
| 80% | 79.9% | 1,192,350 | 1,191,188 |
| 70% | 70.2% | 1,043,307 | 1,045,830 |
| 60% | 59.8% | 894,263 | 891,014 |
| 50% | 50.0% | 745,219 | 745,553 |
| 40% | 40.3% | 596,175 | 600,264 |
| 30% | 29.9% | 447,131 | 446,253 |
| 20% | 20.0% | 298,088 | 297,586 |
| 10% | 10.0% | 149,044 | 148,804 |
| Active Idle | 0 | 0 | |
