
SPECpower_ssj2008
Host 'SY480-08' Performance Report
Copyright © 2007-2019 Standard Performance Evaluation Corporation
| Hewlett Packard Enterprise Synergy 480 Gen10 Compute Module | ssj_ops@100% = 5,925,178 ssj_ops@100% per JVM = 1,481,294 |
||||
| Test Sponsor: | Hewlett Packard Enterprise | SPEC License #: | 3 | Test Method: | Multi Node |
| Tested By: | Hewlett Packard Enterprise | Test Location: | Houston, TX, USA | Test Date: | Mar 12, 2019 |
| Hardware Availability: | Apr-2019 | Software Availability: | Mar-2019 | Publication: | Apr 2, 2019 |
| System Source: | Single Supplier | System Designation: | Server | Power Provisioning: | Line-powered |
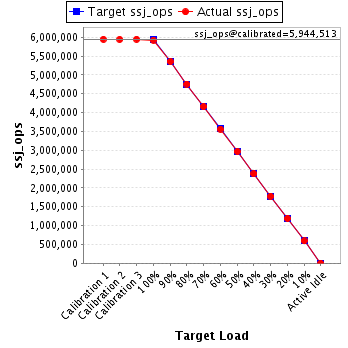
| Target Load | Actual Load | ssj_ops | |
|---|---|---|---|
| Target | Actual | ||
| Calibration 1 | 5,947,006 | ||
| Calibration 2 | 5,941,134 | ||
| Calibration 3 | 5,947,892 | ||
| ssj_ops@calibrated=5,944,513 | |||
| 100% | 99.7% | 5,944,513 | 5,925,178 |
| 90% | 90.1% | 5,350,061 | 5,354,395 |
| 80% | 80.0% | 4,755,610 | 4,757,830 |
| 70% | 70.0% | 4,161,159 | 4,158,871 |
| 60% | 59.9% | 3,566,708 | 3,563,447 |
| 50% | 49.9% | 2,972,256 | 2,965,309 |
| 40% | 39.9% | 2,377,805 | 2,371,450 |
| 30% | 30.0% | 1,783,354 | 1,783,150 |
| 20% | 20.0% | 1,188,903 | 1,190,466 |
| 10% | 10.0% | 594,451 | 591,857 |
| Active Idle | 0 | 0 | |
| Set Identifier: | SUT |
| Set Description: | System Under Test |
| # of Identical Nodes: | 11 |
| Comment: | SUT |
| Hardware | |
|---|---|
| Hardware Vendor: | Hewlett Packard Enterprise |
| Model: | Synergy 480 Gen10 Compute Module |
| Form Factor: | blade |
| CPU Name: | Intel Xeon Platinum 8280 @ 2.70GHz |
| CPU Characteristics: | 28-Core, 2.70 GHz, 38.5MB L3 Cache |
| CPU Frequency (MHz): | 2700 |
| CPU(s) Enabled: | 56 cores, 2 chips, 28 cores/chip |
| Hardware Threads: | 112 (2 / core) |
| CPU(s) Orderable: | 1,2 chips |
| Primary Cache: | 32 KB I + 32 KB D on chip per core |
| Secondary Cache: | 1 MB I+D on chip per core |
| Tertiary Cache: | 39424 KB I+D on chip per chip |
| Other Cache: | None |
| Memory Amount (GB): | 192 |
| # and size of DIMM: | 12 x 16384 MB |
| Memory Details: | 12 x 16GB 2Rx8 PC4-2933Y-R; slots 1, 3, 5, 8, 10 and 12 populated on each socket |
| Power Supply Quantity and Rating (W): | None |
| Power Supply Details: | N/A |
| Disk Drive: | 1 x HPE 480GB SATA 6G M.2 2280 (875498-B21) |
| Disk Controller: | HPE Smart Array S100i SR Gen10 |
| # and type of Network Interface Cards (NICs) Installed: | 1 x HPE Synergy 3820C 10/20Gb CNA |
| NICs Enabled in Firmware / OS / Connected: | 2/2/1 |
| Network Speed (Mbit): | 1000 |
| Keyboard: | None |
| Mouse: | None |
| Monitor: | None |
| Optical Drives: | No |
| Other Hardware: | None |
| Software | |
|---|---|
| Power Management: | Enabled (see SUT Notes) |
| Operating System (OS): | SUSE Linux Enterprise Server 12 SP4 |
| OS Version: | 4.12.14-94.41-default |
| Filesystem: | xfs |
| JVM Vendor: | Oracle Corporation |
| JVM Version: | Oracle Java HotSpot(TM) 64-Bit Server VM (build 24.80-b11, mixed mode), version 1.7.0_80 |
| JVM Command-line Options: | -server -Xmn19g -Xms21g -Xmx21g -XX:SurvivorRatio=1 -XX:TargetSurvivorRatio=99 -XX:AllocatePrefetchDistance=384 -XX:AllocatePrefetchLines=4 -XX:LoopUnrollLimit=37 -XX:InitialTenuringThreshold=12 -XX:MaxTenuringThreshold=15 -XX:ParallelGCThreads=28 -XX:InlineSmallCode=3900 -XX:MaxInlineSize=270 -XX:FreqInlineSize=2500 -XX:+AggressiveOpts -XX:+UseLargePages -XX:+UseParallelOldGC |
| JVM Affinity: | numactl --cpunodebind=[0-3] --localalloc |
| JVM Instances: | 4 |
| JVM Initial Heap (MB): | 21000 |
| JVM Maximum Heap (MB): | 21000 |
| JVM Address Bits: | 64 |
| Boot Firmware Version: | I42 v2.00 (02/02/2019) |
| Management Firmware Version: | 1.40 Feb 05 2019 |
| Workload Version: | SSJ 1.2.10 |
| Director Location: | Controller |
| Other Software: | HPE Service Pack for ProLiant (SPP) - Version 2019.03.0 (Mar 2019) |
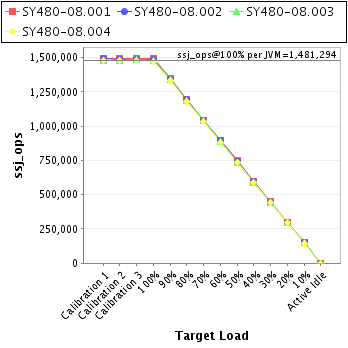
| JVM Instance | ssj_ops@100% |
|---|---|
| SY480-08.001 | 1,491,062 |
| SY480-08.002 | 1,484,813 |
| SY480-08.003 | 1,477,574 |
| SY480-08.004 | 1,471,728 |
| ssj_ops@100% | 5,925,178 |
| ssj_ops@100% per JVM | 1,481,294 |
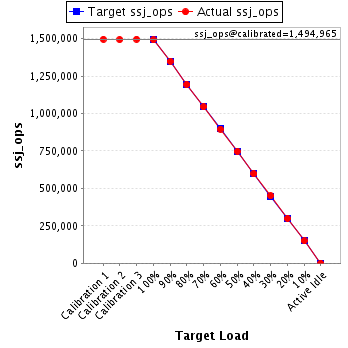
| Target Load | Actual Load | ssj_ops | |
|---|---|---|---|
| Target | Actual | ||
| Calibration 1 | 1,496,032 | ||
| Calibration 2 | 1,493,605 | ||
| Calibration 3 | 1,496,325 | ||
| ssj_ops@calibrated=1,494,965 | |||
| 100% | 99.7% | 1,494,965 | 1,491,062 |
| 90% | 90.2% | 1,345,468 | 1,348,494 |
| 80% | 79.9% | 1,195,972 | 1,193,765 |
| 70% | 69.8% | 1,046,475 | 1,044,138 |
| 60% | 60.0% | 896,979 | 896,319 |
| 50% | 50.0% | 747,482 | 747,174 |
| 40% | 39.9% | 597,986 | 596,472 |
| 30% | 30.1% | 448,489 | 449,583 |
| 20% | 20.0% | 298,993 | 298,911 |
| 10% | 10.0% | 149,496 | 149,074 |
| Active Idle | 0 | 0 | |
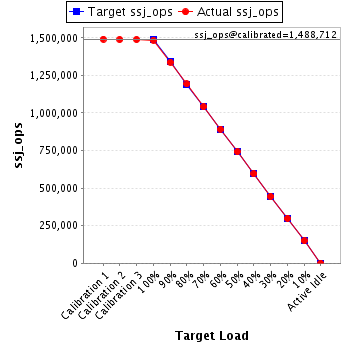
| Target Load | Actual Load | ssj_ops | |
|---|---|---|---|
| Target | Actual | ||
| Calibration 1 | 1,491,164 | ||
| Calibration 2 | 1,488,539 | ||
| Calibration 3 | 1,488,886 | ||
| ssj_ops@calibrated=1,488,712 | |||
| 100% | 99.7% | 1,488,712 | 1,484,813 |
| 90% | 89.9% | 1,339,841 | 1,337,787 |
| 80% | 80.1% | 1,190,970 | 1,193,187 |
| 70% | 70.0% | 1,042,099 | 1,041,610 |
| 60% | 60.0% | 893,227 | 893,282 |
| 50% | 49.9% | 744,356 | 742,312 |
| 40% | 39.9% | 595,485 | 594,700 |
| 30% | 29.9% | 446,614 | 444,549 |
| 20% | 20.0% | 297,742 | 298,363 |
| 10% | 10.1% | 148,871 | 149,788 |
| Active Idle | 0 | 0 | |
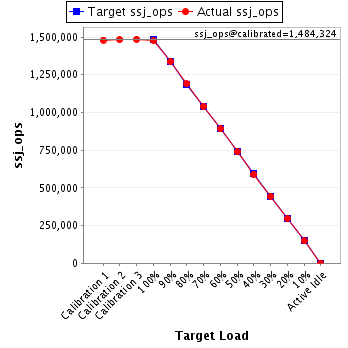
| Target Load | Actual Load | ssj_ops | |
|---|---|---|---|
| Target | Actual | ||
| Calibration 1 | 1,480,019 | ||
| Calibration 2 | 1,482,759 | ||
| Calibration 3 | 1,485,888 | ||
| ssj_ops@calibrated=1,484,324 | |||
| 100% | 99.5% | 1,484,324 | 1,477,574 |
| 90% | 90.1% | 1,335,891 | 1,337,737 |
| 80% | 80.2% | 1,187,459 | 1,191,166 |
| 70% | 70.0% | 1,039,026 | 1,039,586 |
| 60% | 60.0% | 890,594 | 890,626 |
| 50% | 49.8% | 742,162 | 738,733 |
| 40% | 39.8% | 593,729 | 590,860 |
| 30% | 30.0% | 445,297 | 444,621 |
| 20% | 20.1% | 296,865 | 297,653 |
| 10% | 10.0% | 148,432 | 147,887 |
| Active Idle | 0 | 0 | |
| Target Load | Actual Load | ssj_ops | |
|---|---|---|---|
| Target | Actual | ||
| Calibration 1 | 1,479,791 | ||
| Calibration 2 | 1,476,231 | ||
| Calibration 3 | 1,476,792 | ||
| ssj_ops@calibrated=1,476,512 | |||
| 100% | 99.7% | 1,476,512 | 1,471,728 |
| 90% | 90.1% | 1,328,861 | 1,330,376 |
| 80% | 79.9% | 1,181,210 | 1,179,712 |
| 70% | 70.0% | 1,033,558 | 1,033,536 |
| 60% | 59.8% | 885,907 | 883,220 |
| 50% | 49.9% | 738,256 | 737,091 |
| 40% | 39.9% | 590,605 | 589,420 |
| 30% | 30.1% | 442,954 | 444,396 |
| 20% | 20.0% | 295,302 | 295,538 |
| 10% | 9.8% | 147,651 | 145,109 |
| Active Idle | 0 | 0 | |
