SPECpower_ssj2008
Host 'SY480-05' Performance Report
Copyright © 2007-2019 Standard Performance Evaluation Corporation
| Hewlett Packard Enterprise Synergy 480 Gen10 Compute Module | ssj_ops@100% = 5,866,318 ssj_ops@100% per JVM = 1,466,579 |
||||
| Test Sponsor: | Hewlett Packard Enterprise | SPEC License #: | 3 | Test Method: | Multi Node |
| Tested By: | Hewlett Packard Enterprise | Test Location: | Houston, TX, USA | Test Date: | Mar 12, 2019 |
| Hardware Availability: | Apr-2019 | Software Availability: | Mar-2019 | Publication: | Apr 2, 2019 |
| System Source: | Single Supplier | System Designation: | Server | Power Provisioning: | Line-powered |
| Target Load | Actual Load | ssj_ops | |
|---|---|---|---|
| Target | Actual | ||
| Calibration 1 | 5,902,455 | ||
| Calibration 2 | 5,883,282 | ||
| Calibration 3 | 5,891,031 | ||
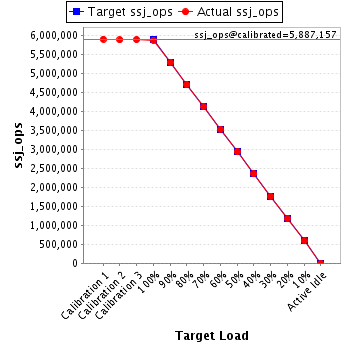
| ssj_ops@calibrated=5,887,157 | |||
| 100% | 99.6% | 5,887,157 | 5,866,318 |
| 90% | 89.9% | 5,298,441 | 5,291,713 |
| 80% | 79.9% | 4,709,725 | 4,706,447 |
| 70% | 70.0% | 4,121,010 | 4,120,571 |
| 60% | 60.0% | 3,532,294 | 3,534,168 |
| 50% | 49.9% | 2,943,578 | 2,935,551 |
| 40% | 40.0% | 2,354,863 | 2,355,467 |
| 30% | 30.0% | 1,766,147 | 1,765,641 |
| 20% | 20.0% | 1,177,431 | 1,179,197 |
| 10% | 10.0% | 588,716 | 588,659 |
| Active Idle | 0 | 0 | |
| Set Identifier: | SUT |
| Set Description: | System Under Test |
| # of Identical Nodes: | 11 |
| Comment: | SUT |
| Hardware | |
|---|---|
| Hardware Vendor: | Hewlett Packard Enterprise |
| Model: | Synergy 480 Gen10 Compute Module |
| Form Factor: | blade |
| CPU Name: | Intel Xeon Platinum 8280 @ 2.70GHz |
| CPU Characteristics: | 28-Core, 2.70 GHz, 38.5MB L3 Cache |
| CPU Frequency (MHz): | 2700 |
| CPU(s) Enabled: | 56 cores, 2 chips, 28 cores/chip |
| Hardware Threads: | 112 (2 / core) |
| CPU(s) Orderable: | 1,2 chips |
| Primary Cache: | 32 KB I + 32 KB D on chip per core |
| Secondary Cache: | 1 MB I+D on chip per core |
| Tertiary Cache: | 39424 KB I+D on chip per chip |
| Other Cache: | None |
| Memory Amount (GB): | 192 |
| # and size of DIMM: | 12 x 16384 MB |
| Memory Details: | 12 x 16GB 2Rx8 PC4-2933Y-R; slots 1, 3, 5, 8, 10 and 12 populated on each socket |
| Power Supply Quantity and Rating (W): | None |
| Power Supply Details: | N/A |
| Disk Drive: | 1 x HPE 480GB SATA 6G M.2 2280 (875498-B21) |
| Disk Controller: | HPE Smart Array S100i SR Gen10 |
| # and type of Network Interface Cards (NICs) Installed: | 1 x HPE Synergy 3820C 10/20Gb CNA |
| NICs Enabled in Firmware / OS / Connected: | 2/2/1 |
| Network Speed (Mbit): | 1000 |
| Keyboard: | None |
| Mouse: | None |
| Monitor: | None |
| Optical Drives: | No |
| Other Hardware: | None |
| Software | |
|---|---|
| Power Management: | Enabled (see SUT Notes) |
| Operating System (OS): | SUSE Linux Enterprise Server 12 SP4 |
| OS Version: | 4.12.14-94.41-default |
| Filesystem: | xfs |
| JVM Vendor: | Oracle Corporation |
| JVM Version: | Oracle Java HotSpot(TM) 64-Bit Server VM (build 24.80-b11, mixed mode), version 1.7.0_80 |
| JVM Command-line Options: | -server -Xmn19g -Xms21g -Xmx21g -XX:SurvivorRatio=1 -XX:TargetSurvivorRatio=99 -XX:AllocatePrefetchDistance=384 -XX:AllocatePrefetchLines=4 -XX:LoopUnrollLimit=37 -XX:InitialTenuringThreshold=12 -XX:MaxTenuringThreshold=15 -XX:ParallelGCThreads=28 -XX:InlineSmallCode=3900 -XX:MaxInlineSize=270 -XX:FreqInlineSize=2500 -XX:+AggressiveOpts -XX:+UseLargePages -XX:+UseParallelOldGC |
| JVM Affinity: | numactl --cpunodebind=[0-3] --localalloc |
| JVM Instances: | 4 |
| JVM Initial Heap (MB): | 21000 |
| JVM Maximum Heap (MB): | 21000 |
| JVM Address Bits: | 64 |
| Boot Firmware Version: | I42 v2.00 (02/02/2019) |
| Management Firmware Version: | 1.40 Feb 05 2019 |
| Workload Version: | SSJ 1.2.10 |
| Director Location: | Controller |
| Other Software: | HPE Service Pack for ProLiant (SPP) - Version 2019.03.0 (Mar 2019) |
| JVM Instance | ssj_ops@100% |
|---|---|
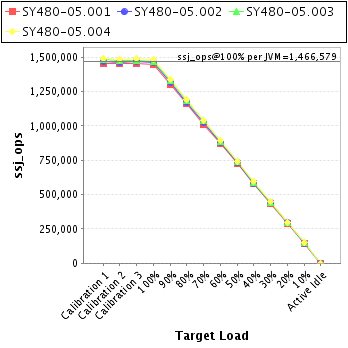
| SY480-05.001 | 1,447,930 |
| SY480-05.002 | 1,461,214 |
| SY480-05.003 | 1,472,113 |
| SY480-05.004 | 1,485,060 |
| ssj_ops@100% | 5,866,318 |
| ssj_ops@100% per JVM | 1,466,579 |
| Target Load | Actual Load | ssj_ops | |
|---|---|---|---|
| Target | Actual | ||
| Calibration 1 | 1,457,453 | ||
| Calibration 2 | 1,452,776 | ||
| Calibration 3 | 1,454,840 | ||
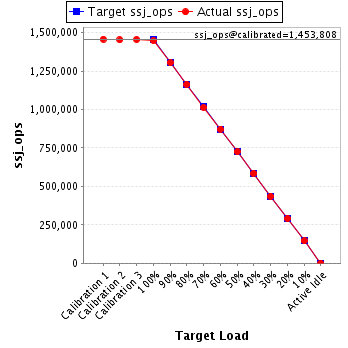
| ssj_ops@calibrated=1,453,808 | |||
| 100% | 99.6% | 1,453,808 | 1,447,930 |
| 90% | 89.7% | 1,308,427 | 1,303,949 |
| 80% | 80.0% | 1,163,046 | 1,162,702 |
| 70% | 69.7% | 1,017,666 | 1,013,858 |
| 60% | 60.0% | 872,285 | 873,006 |
| 50% | 49.9% | 726,904 | 724,878 |
| 40% | 40.2% | 581,523 | 584,007 |
| 30% | 30.0% | 436,142 | 436,166 |
| 20% | 20.0% | 290,762 | 291,198 |
| 10% | 10.0% | 145,381 | 145,957 |
| Active Idle | 0 | 0 | |
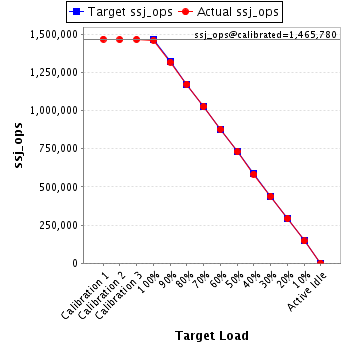
| Target Load | Actual Load | ssj_ops | |
|---|---|---|---|
| Target | Actual | ||
| Calibration 1 | 1,467,983 | ||
| Calibration 2 | 1,464,937 | ||
| Calibration 3 | 1,466,624 | ||
| ssj_ops@calibrated=1,465,780 | |||
| 100% | 99.7% | 1,465,780 | 1,461,214 |
| 90% | 89.9% | 1,319,202 | 1,317,448 |
| 80% | 80.0% | 1,172,624 | 1,172,666 |
| 70% | 70.0% | 1,026,046 | 1,026,230 |
| 60% | 60.0% | 879,468 | 879,022 |
| 50% | 49.8% | 732,890 | 730,343 |
| 40% | 39.8% | 586,312 | 584,037 |
| 30% | 30.0% | 439,734 | 439,187 |
| 20% | 20.0% | 293,156 | 293,502 |
| 10% | 10.0% | 146,578 | 145,936 |
| Active Idle | 0 | 0 | |
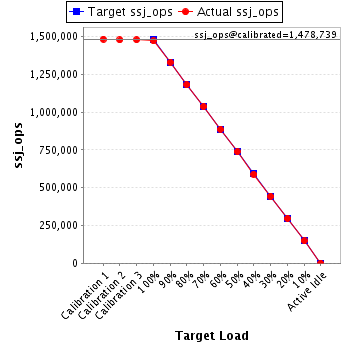
| Target Load | Actual Load | ssj_ops | |
|---|---|---|---|
| Target | Actual | ||
| Calibration 1 | 1,483,898 | ||
| Calibration 2 | 1,478,504 | ||
| Calibration 3 | 1,478,973 | ||
| ssj_ops@calibrated=1,478,739 | |||
| 100% | 99.6% | 1,478,739 | 1,472,113 |
| 90% | 90.0% | 1,330,865 | 1,331,474 |
| 80% | 79.9% | 1,182,991 | 1,182,089 |
| 70% | 70.2% | 1,035,117 | 1,038,438 |
| 60% | 60.1% | 887,243 | 887,990 |
| 50% | 49.9% | 739,369 | 738,407 |
| 40% | 39.9% | 591,495 | 589,756 |
| 30% | 30.0% | 443,622 | 443,663 |
| 20% | 20.1% | 295,748 | 296,598 |
| 10% | 10.0% | 147,874 | 148,266 |
| Active Idle | 0 | 0 | |
| Target Load | Actual Load | ssj_ops | |
|---|---|---|---|
| Target | Actual | ||
| Calibration 1 | 1,493,121 | ||
| Calibration 2 | 1,487,065 | ||
| Calibration 3 | 1,490,594 | ||
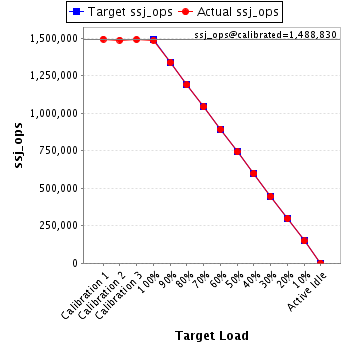
| ssj_ops@calibrated=1,488,830 | |||
| 100% | 99.7% | 1,488,830 | 1,485,060 |
| 90% | 89.9% | 1,339,947 | 1,338,842 |
| 80% | 79.9% | 1,191,064 | 1,188,990 |
| 70% | 70.0% | 1,042,181 | 1,042,045 |
| 60% | 60.1% | 893,298 | 894,150 |
| 50% | 49.8% | 744,415 | 741,924 |
| 40% | 40.1% | 595,532 | 597,667 |
| 30% | 30.0% | 446,649 | 446,625 |
| 20% | 20.0% | 297,766 | 297,898 |
| 10% | 10.0% | 148,883 | 148,501 |
| Active Idle | 0 | 0 | |