
SPECpower_ssj2008
Host 'SY480-04' Performance Report
Copyright © 2007-2019 Standard Performance Evaluation Corporation
| Hewlett Packard Enterprise Synergy 480 Gen10 Compute Module | ssj_ops@100% = 5,956,919 ssj_ops@100% per JVM = 1,489,230 |
||||
| Test Sponsor: | Hewlett Packard Enterprise | SPEC License #: | 3 | Test Method: | Multi Node |
| Tested By: | Hewlett Packard Enterprise | Test Location: | Houston, TX, USA | Test Date: | Mar 12, 2019 |
| Hardware Availability: | Apr-2019 | Software Availability: | Mar-2019 | Publication: | Apr 2, 2019 |
| System Source: | Single Supplier | System Designation: | Server | Power Provisioning: | Line-powered |
| Target Load | Actual Load | ssj_ops | |
|---|---|---|---|
| Target | Actual | ||
| Calibration 1 | 5,975,560 | ||
| Calibration 2 | 5,959,750 | ||
| Calibration 3 | 5,968,450 | ||
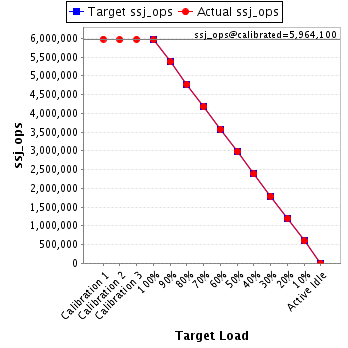
| ssj_ops@calibrated=5,964,100 | |||
| 100% | 99.9% | 5,964,100 | 5,956,919 |
| 90% | 90.1% | 5,367,690 | 5,373,046 |
| 80% | 80.0% | 4,771,280 | 4,769,587 |
| 70% | 70.0% | 4,174,870 | 4,177,517 |
| 60% | 60.0% | 3,578,460 | 3,576,870 |
| 50% | 50.0% | 2,982,050 | 2,981,877 |
| 40% | 39.9% | 2,385,640 | 2,381,228 |
| 30% | 30.0% | 1,789,230 | 1,786,871 |
| 20% | 20.0% | 1,192,820 | 1,194,265 |
| 10% | 10.0% | 596,410 | 595,390 |
| Active Idle | 0 | 0 | |
| Set Identifier: | SUT |
| Set Description: | System Under Test |
| # of Identical Nodes: | 11 |
| Comment: | SUT |
| Hardware | |
|---|---|
| Hardware Vendor: | Hewlett Packard Enterprise |
| Model: | Synergy 480 Gen10 Compute Module |
| Form Factor: | blade |
| CPU Name: | Intel Xeon Platinum 8280 @ 2.70GHz |
| CPU Characteristics: | 28-Core, 2.70 GHz, 38.5MB L3 Cache |
| CPU Frequency (MHz): | 2700 |
| CPU(s) Enabled: | 56 cores, 2 chips, 28 cores/chip |
| Hardware Threads: | 112 (2 / core) |
| CPU(s) Orderable: | 1,2 chips |
| Primary Cache: | 32 KB I + 32 KB D on chip per core |
| Secondary Cache: | 1 MB I+D on chip per core |
| Tertiary Cache: | 39424 KB I+D on chip per chip |
| Other Cache: | None |
| Memory Amount (GB): | 192 |
| # and size of DIMM: | 12 x 16384 MB |
| Memory Details: | 12 x 16GB 2Rx8 PC4-2933Y-R; slots 1, 3, 5, 8, 10 and 12 populated on each socket |
| Power Supply Quantity and Rating (W): | None |
| Power Supply Details: | N/A |
| Disk Drive: | 1 x HPE 480GB SATA 6G M.2 2280 (875498-B21) |
| Disk Controller: | HPE Smart Array S100i SR Gen10 |
| # and type of Network Interface Cards (NICs) Installed: | 1 x HPE Synergy 3820C 10/20Gb CNA |
| NICs Enabled in Firmware / OS / Connected: | 2/2/1 |
| Network Speed (Mbit): | 1000 |
| Keyboard: | None |
| Mouse: | None |
| Monitor: | None |
| Optical Drives: | No |
| Other Hardware: | None |
| Software | |
|---|---|
| Power Management: | Enabled (see SUT Notes) |
| Operating System (OS): | SUSE Linux Enterprise Server 12 SP4 |
| OS Version: | 4.12.14-94.41-default |
| Filesystem: | xfs |
| JVM Vendor: | Oracle Corporation |
| JVM Version: | Oracle Java HotSpot(TM) 64-Bit Server VM (build 24.80-b11, mixed mode), version 1.7.0_80 |
| JVM Command-line Options: | -server -Xmn19g -Xms21g -Xmx21g -XX:SurvivorRatio=1 -XX:TargetSurvivorRatio=99 -XX:AllocatePrefetchDistance=384 -XX:AllocatePrefetchLines=4 -XX:LoopUnrollLimit=37 -XX:InitialTenuringThreshold=12 -XX:MaxTenuringThreshold=15 -XX:ParallelGCThreads=28 -XX:InlineSmallCode=3900 -XX:MaxInlineSize=270 -XX:FreqInlineSize=2500 -XX:+AggressiveOpts -XX:+UseLargePages -XX:+UseParallelOldGC |
| JVM Affinity: | numactl --cpunodebind=[0-3] --localalloc |
| JVM Instances: | 4 |
| JVM Initial Heap (MB): | 21000 |
| JVM Maximum Heap (MB): | 21000 |
| JVM Address Bits: | 64 |
| Boot Firmware Version: | I42 v2.00 (02/02/2019) |
| Management Firmware Version: | 1.40 Feb 05 2019 |
| Workload Version: | SSJ 1.2.10 |
| Director Location: | Controller |
| Other Software: | HPE Service Pack for ProLiant (SPP) - Version 2019.03.0 (Mar 2019) |
| JVM Instance | ssj_ops@100% |
|---|---|
| SY480-04.001 | 1,487,700 |
| SY480-04.002 | 1,494,867 |
| SY480-04.003 | 1,489,267 |
| SY480-04.004 | 1,485,085 |
| ssj_ops@100% | 5,956,919 |
| ssj_ops@100% per JVM | 1,489,230 |

| Target Load | Actual Load | ssj_ops | |
|---|---|---|---|
| Target | Actual | ||
| Calibration 1 | 1,492,562 | ||
| Calibration 2 | 1,488,087 | ||
| Calibration 3 | 1,490,780 | ||
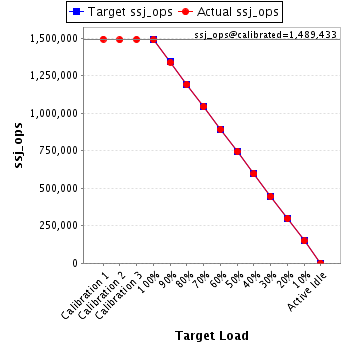
| ssj_ops@calibrated=1,489,433 | |||
| 100% | 99.9% | 1,489,433 | 1,487,700 |
| 90% | 89.8% | 1,340,490 | 1,337,826 |
| 80% | 80.0% | 1,191,547 | 1,190,929 |
| 70% | 70.0% | 1,042,603 | 1,043,002 |
| 60% | 59.9% | 893,660 | 892,423 |
| 50% | 50.0% | 744,717 | 744,135 |
| 40% | 39.9% | 595,773 | 594,861 |
| 30% | 29.9% | 446,830 | 445,746 |
| 20% | 20.0% | 297,887 | 298,125 |
| 10% | 10.0% | 148,943 | 148,715 |
| Active Idle | 0 | 0 | |
| Target Load | Actual Load | ssj_ops | |
|---|---|---|---|
| Target | Actual | ||
| Calibration 1 | 1,500,185 | ||
| Calibration 2 | 1,495,456 | ||
| Calibration 3 | 1,496,706 | ||
| ssj_ops@calibrated=1,496,081 | |||
| 100% | 99.9% | 1,496,081 | 1,494,867 |
| 90% | 90.2% | 1,346,473 | 1,349,657 |
| 80% | 79.7% | 1,196,865 | 1,192,570 |
| 70% | 70.1% | 1,047,257 | 1,048,351 |
| 60% | 60.1% | 897,649 | 899,601 |
| 50% | 49.8% | 748,041 | 745,653 |
| 40% | 40.0% | 598,432 | 598,367 |
| 30% | 30.1% | 448,824 | 449,614 |
| 20% | 20.0% | 299,216 | 299,940 |
| 10% | 10.0% | 149,608 | 150,170 |
| Active Idle | 0 | 0 | |

| Target Load | Actual Load | ssj_ops | |
|---|---|---|---|
| Target | Actual | ||
| Calibration 1 | 1,493,728 | ||
| Calibration 2 | 1,490,691 | ||
| Calibration 3 | 1,491,622 | ||
| ssj_ops@calibrated=1,491,156 | |||
| 100% | 99.9% | 1,491,156 | 1,489,267 |
| 90% | 90.1% | 1,342,041 | 1,344,004 |
| 80% | 80.1% | 1,192,925 | 1,194,173 |
| 70% | 69.9% | 1,043,809 | 1,042,155 |
| 60% | 60.0% | 894,694 | 894,126 |
| 50% | 50.2% | 745,578 | 748,239 |
| 40% | 39.9% | 596,463 | 594,939 |
| 30% | 30.0% | 447,347 | 447,742 |
| 20% | 20.0% | 298,231 | 297,570 |
| 10% | 10.0% | 149,116 | 148,658 |
| Active Idle | 0 | 0 | |

| Target Load | Actual Load | ssj_ops | |
|---|---|---|---|
| Target | Actual | ||
| Calibration 1 | 1,489,085 | ||
| Calibration 2 | 1,485,516 | ||
| Calibration 3 | 1,489,343 | ||
| ssj_ops@calibrated=1,487,429 | |||
| 100% | 99.8% | 1,487,429 | 1,485,085 |
| 90% | 90.2% | 1,338,686 | 1,341,560 |
| 80% | 80.1% | 1,189,944 | 1,191,916 |
| 70% | 70.2% | 1,041,201 | 1,044,009 |
| 60% | 59.9% | 892,458 | 890,720 |
| 50% | 50.0% | 743,715 | 743,850 |
| 40% | 39.9% | 594,972 | 593,061 |
| 30% | 29.8% | 446,229 | 443,768 |
| 20% | 20.1% | 297,486 | 298,630 |
| 10% | 9.9% | 148,743 | 147,848 |
| Active Idle | 0 | 0 | |
