SPECpower_ssj2008
Host 'SY480-02' Performance Report
Copyright © 2007-2019 Standard Performance Evaluation Corporation
| Hewlett Packard Enterprise Synergy 480 Gen10 Compute Module | ssj_ops@100% = 5,927,801 ssj_ops@100% per JVM = 1,481,950 |
||||
| Test Sponsor: | Hewlett Packard Enterprise | SPEC License #: | 3 | Test Method: | Multi Node |
| Tested By: | Hewlett Packard Enterprise | Test Location: | Houston, TX, USA | Test Date: | Mar 12, 2019 |
| Hardware Availability: | Apr-2019 | Software Availability: | Mar-2019 | Publication: | Apr 2, 2019 |
| System Source: | Single Supplier | System Designation: | Server | Power Provisioning: | Line-powered |
| Target Load | Actual Load | ssj_ops | |
|---|---|---|---|
| Target | Actual | ||
| Calibration 1 | 5,942,610 | ||
| Calibration 2 | 5,935,633 | ||
| Calibration 3 | 5,943,963 | ||
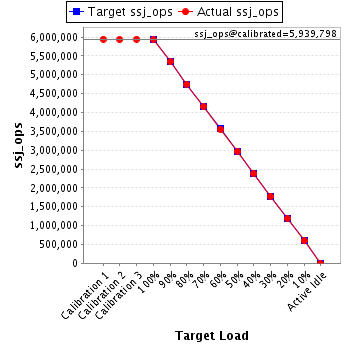
| ssj_ops@calibrated=5,939,798 | |||
| 100% | 99.8% | 5,939,798 | 5,927,801 |
| 90% | 90.0% | 5,345,818 | 5,348,598 |
| 80% | 80.0% | 4,751,838 | 4,750,298 |
| 70% | 70.0% | 4,157,859 | 4,157,806 |
| 60% | 59.9% | 3,563,879 | 3,559,463 |
| 50% | 50.0% | 2,969,899 | 2,968,909 |
| 40% | 40.0% | 2,375,919 | 2,378,228 |
| 30% | 29.9% | 1,781,939 | 1,777,181 |
| 20% | 20.0% | 1,187,960 | 1,186,712 |
| 10% | 10.0% | 593,980 | 592,340 |
| Active Idle | 0 | 0 | |
| Set Identifier: | SUT |
| Set Description: | System Under Test |
| # of Identical Nodes: | 11 |
| Comment: | SUT |
| Hardware | |
|---|---|
| Hardware Vendor: | Hewlett Packard Enterprise |
| Model: | Synergy 480 Gen10 Compute Module |
| Form Factor: | blade |
| CPU Name: | Intel Xeon Platinum 8280 @ 2.70GHz |
| CPU Characteristics: | 28-Core, 2.70 GHz, 38.5MB L3 Cache |
| CPU Frequency (MHz): | 2700 |
| CPU(s) Enabled: | 56 cores, 2 chips, 28 cores/chip |
| Hardware Threads: | 112 (2 / core) |
| CPU(s) Orderable: | 1,2 chips |
| Primary Cache: | 32 KB I + 32 KB D on chip per core |
| Secondary Cache: | 1 MB I+D on chip per core |
| Tertiary Cache: | 39424 KB I+D on chip per chip |
| Other Cache: | None |
| Memory Amount (GB): | 192 |
| # and size of DIMM: | 12 x 16384 MB |
| Memory Details: | 12 x 16GB 2Rx8 PC4-2933Y-R; slots 1, 3, 5, 8, 10 and 12 populated on each socket |
| Power Supply Quantity and Rating (W): | None |
| Power Supply Details: | N/A |
| Disk Drive: | 1 x HPE 480GB SATA 6G M.2 2280 (875498-B21) |
| Disk Controller: | HPE Smart Array S100i SR Gen10 |
| # and type of Network Interface Cards (NICs) Installed: | 1 x HPE Synergy 3820C 10/20Gb CNA |
| NICs Enabled in Firmware / OS / Connected: | 2/2/1 |
| Network Speed (Mbit): | 1000 |
| Keyboard: | None |
| Mouse: | None |
| Monitor: | None |
| Optical Drives: | No |
| Other Hardware: | None |
| Software | |
|---|---|
| Power Management: | Enabled (see SUT Notes) |
| Operating System (OS): | SUSE Linux Enterprise Server 12 SP4 |
| OS Version: | 4.12.14-94.41-default |
| Filesystem: | xfs |
| JVM Vendor: | Oracle Corporation |
| JVM Version: | Oracle Java HotSpot(TM) 64-Bit Server VM (build 24.80-b11, mixed mode), version 1.7.0_80 |
| JVM Command-line Options: | -server -Xmn19g -Xms21g -Xmx21g -XX:SurvivorRatio=1 -XX:TargetSurvivorRatio=99 -XX:AllocatePrefetchDistance=384 -XX:AllocatePrefetchLines=4 -XX:LoopUnrollLimit=37 -XX:InitialTenuringThreshold=12 -XX:MaxTenuringThreshold=15 -XX:ParallelGCThreads=28 -XX:InlineSmallCode=3900 -XX:MaxInlineSize=270 -XX:FreqInlineSize=2500 -XX:+AggressiveOpts -XX:+UseLargePages -XX:+UseParallelOldGC |
| JVM Affinity: | numactl --cpunodebind=[0-3] --localalloc |
| JVM Instances: | 4 |
| JVM Initial Heap (MB): | 21000 |
| JVM Maximum Heap (MB): | 21000 |
| JVM Address Bits: | 64 |
| Boot Firmware Version: | I42 v2.00 (02/02/2019) |
| Management Firmware Version: | 1.40 Feb 05 2019 |
| Workload Version: | SSJ 1.2.10 |
| Director Location: | Controller |
| Other Software: | HPE Service Pack for ProLiant (SPP) - Version 2019.03.0 (Mar 2019) |
| JVM Instance | ssj_ops@100% |
|---|---|
| SY480-02.001 | 1,484,980 |
| SY480-02.002 | 1,464,798 |
| SY480-02.003 | 1,493,422 |
| SY480-02.004 | 1,484,601 |
| ssj_ops@100% | 5,927,801 |
| ssj_ops@100% per JVM | 1,481,950 |

| Target Load | Actual Load | ssj_ops | |
|---|---|---|---|
| Target | Actual | ||
| Calibration 1 | 1,492,684 | ||
| Calibration 2 | 1,488,016 | ||
| Calibration 3 | 1,490,317 | ||
| ssj_ops@calibrated=1,489,166 | |||
| 100% | 99.7% | 1,489,166 | 1,484,980 |
| 90% | 90.3% | 1,340,250 | 1,344,487 |
| 80% | 79.9% | 1,191,333 | 1,190,524 |
| 70% | 69.9% | 1,042,416 | 1,040,868 |
| 60% | 59.9% | 893,500 | 891,726 |
| 50% | 49.9% | 744,583 | 742,909 |
| 40% | 40.0% | 595,667 | 596,299 |
| 30% | 29.8% | 446,750 | 443,686 |
| 20% | 19.9% | 297,833 | 295,898 |
| 10% | 10.0% | 148,917 | 148,429 |
| Active Idle | 0 | 0 | |

| Target Load | Actual Load | ssj_ops | |
|---|---|---|---|
| Target | Actual | ||
| Calibration 1 | 1,468,035 | ||
| Calibration 2 | 1,467,198 | ||
| Calibration 3 | 1,469,665 | ||
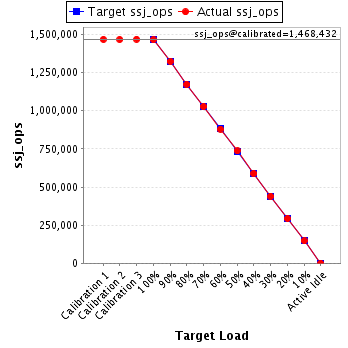
| ssj_ops@calibrated=1,468,432 | |||
| 100% | 99.8% | 1,468,432 | 1,464,798 |
| 90% | 90.2% | 1,321,588 | 1,324,258 |
| 80% | 79.9% | 1,174,745 | 1,173,517 |
| 70% | 70.0% | 1,027,902 | 1,028,428 |
| 60% | 60.0% | 881,059 | 880,436 |
| 50% | 50.2% | 734,216 | 736,525 |
| 40% | 40.1% | 587,373 | 588,248 |
| 30% | 30.0% | 440,529 | 440,534 |
| 20% | 19.9% | 293,686 | 292,381 |
| 10% | 10.0% | 146,843 | 146,758 |
| Active Idle | 0 | 0 | |
| Target Load | Actual Load | ssj_ops | |
|---|---|---|---|
| Target | Actual | ||
| Calibration 1 | 1,493,821 | ||
| Calibration 2 | 1,495,418 | ||
| Calibration 3 | 1,497,608 | ||
| ssj_ops@calibrated=1,496,513 | |||
| 100% | 99.8% | 1,496,513 | 1,493,422 |
| 90% | 89.8% | 1,346,861 | 1,343,892 |
| 80% | 80.2% | 1,197,210 | 1,200,264 |
| 70% | 70.1% | 1,047,559 | 1,049,529 |
| 60% | 60.0% | 897,908 | 898,207 |
| 50% | 49.9% | 748,256 | 746,244 |
| 40% | 40.0% | 598,605 | 598,761 |
| 30% | 30.0% | 448,954 | 448,538 |
| 20% | 20.1% | 299,303 | 300,443 |
| 10% | 10.0% | 149,651 | 149,099 |
| Active Idle | 0 | 0 | |

| Target Load | Actual Load | ssj_ops | |
|---|---|---|---|
| Target | Actual | ||
| Calibration 1 | 1,488,070 | ||
| Calibration 2 | 1,485,001 | ||
| Calibration 3 | 1,486,374 | ||
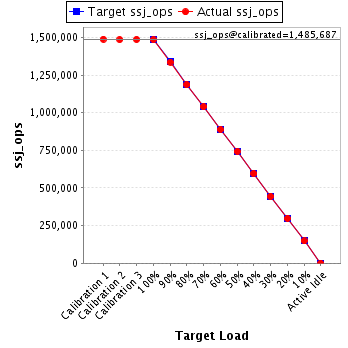
| ssj_ops@calibrated=1,485,687 | |||
| 100% | 99.9% | 1,485,687 | 1,484,601 |
| 90% | 89.9% | 1,337,119 | 1,335,961 |
| 80% | 79.8% | 1,188,550 | 1,185,993 |
| 70% | 69.9% | 1,039,981 | 1,038,982 |
| 60% | 59.8% | 891,412 | 889,093 |
| 50% | 50.0% | 742,844 | 743,231 |
| 40% | 40.0% | 594,275 | 594,920 |
| 30% | 29.9% | 445,706 | 444,423 |
| 20% | 20.1% | 297,137 | 297,990 |
| 10% | 10.0% | 148,569 | 148,054 |
| Active Idle | 0 | 0 | |