
SPECpower_ssj2008
Host 'SY480-01' Performance Report
Copyright © 2007-2019 Standard Performance Evaluation Corporation
| Hewlett Packard Enterprise Synergy 480 Gen10 Compute Module | ssj_ops@100% = 5,919,227 ssj_ops@100% per JVM = 1,479,807 |
||||
| Test Sponsor: | Hewlett Packard Enterprise | SPEC License #: | 3 | Test Method: | Multi Node |
| Tested By: | Hewlett Packard Enterprise | Test Location: | Houston, TX, USA | Test Date: | Mar 12, 2019 |
| Hardware Availability: | Apr-2019 | Software Availability: | Mar-2019 | Publication: | Apr 2, 2019 |
| System Source: | Single Supplier | System Designation: | Server | Power Provisioning: | Line-powered |
| Target Load | Actual Load | ssj_ops | |
|---|---|---|---|
| Target | Actual | ||
| Calibration 1 | 5,944,074 | ||
| Calibration 2 | 5,935,496 | ||
| Calibration 3 | 5,943,128 | ||
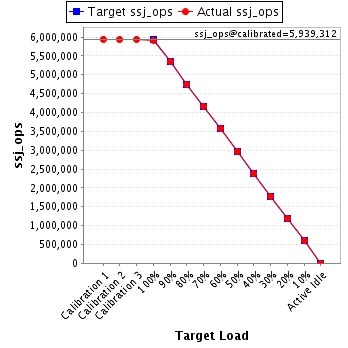
| ssj_ops@calibrated=5,939,312 | |||
| 100% | 99.7% | 5,939,312 | 5,919,227 |
| 90% | 90.0% | 5,345,381 | 5,347,717 |
| 80% | 79.9% | 4,751,450 | 4,745,856 |
| 70% | 70.0% | 4,157,518 | 4,158,908 |
| 60% | 60.0% | 3,563,587 | 3,562,265 |
| 50% | 49.9% | 2,969,656 | 2,965,505 |
| 40% | 40.0% | 2,375,725 | 2,374,154 |
| 30% | 29.9% | 1,781,794 | 1,778,228 |
| 20% | 20.0% | 1,187,862 | 1,188,234 |
| 10% | 10.0% | 593,931 | 595,646 |
| Active Idle | 0 | 0 | |
| Set Identifier: | SUT |
| Set Description: | System Under Test |
| # of Identical Nodes: | 11 |
| Comment: | SUT |
| Hardware | |
|---|---|
| Hardware Vendor: | Hewlett Packard Enterprise |
| Model: | Synergy 480 Gen10 Compute Module |
| Form Factor: | blade |
| CPU Name: | Intel Xeon Platinum 8280 @ 2.70GHz |
| CPU Characteristics: | 28-Core, 2.70 GHz, 38.5MB L3 Cache |
| CPU Frequency (MHz): | 2700 |
| CPU(s) Enabled: | 56 cores, 2 chips, 28 cores/chip |
| Hardware Threads: | 112 (2 / core) |
| CPU(s) Orderable: | 1,2 chips |
| Primary Cache: | 32 KB I + 32 KB D on chip per core |
| Secondary Cache: | 1 MB I+D on chip per core |
| Tertiary Cache: | 39424 KB I+D on chip per chip |
| Other Cache: | None |
| Memory Amount (GB): | 192 |
| # and size of DIMM: | 12 x 16384 MB |
| Memory Details: | 12 x 16GB 2Rx8 PC4-2933Y-R; slots 1, 3, 5, 8, 10 and 12 populated on each socket |
| Power Supply Quantity and Rating (W): | None |
| Power Supply Details: | N/A |
| Disk Drive: | 1 x HPE 480GB SATA 6G M.2 2280 (875498-B21) |
| Disk Controller: | HPE Smart Array S100i SR Gen10 |
| # and type of Network Interface Cards (NICs) Installed: | 1 x HPE Synergy 3820C 10/20Gb CNA |
| NICs Enabled in Firmware / OS / Connected: | 2/2/1 |
| Network Speed (Mbit): | 1000 |
| Keyboard: | None |
| Mouse: | None |
| Monitor: | None |
| Optical Drives: | No |
| Other Hardware: | None |
| Software | |
|---|---|
| Power Management: | Enabled (see SUT Notes) |
| Operating System (OS): | SUSE Linux Enterprise Server 12 SP4 |
| OS Version: | 4.12.14-94.41-default |
| Filesystem: | xfs |
| JVM Vendor: | Oracle Corporation |
| JVM Version: | Oracle Java HotSpot(TM) 64-Bit Server VM (build 24.80-b11, mixed mode), version 1.7.0_80 |
| JVM Command-line Options: | -server -Xmn19g -Xms21g -Xmx21g -XX:SurvivorRatio=1 -XX:TargetSurvivorRatio=99 -XX:AllocatePrefetchDistance=384 -XX:AllocatePrefetchLines=4 -XX:LoopUnrollLimit=37 -XX:InitialTenuringThreshold=12 -XX:MaxTenuringThreshold=15 -XX:ParallelGCThreads=28 -XX:InlineSmallCode=3900 -XX:MaxInlineSize=270 -XX:FreqInlineSize=2500 -XX:+AggressiveOpts -XX:+UseLargePages -XX:+UseParallelOldGC |
| JVM Affinity: | numactl --cpunodebind=[0-3] --localalloc |
| JVM Instances: | 4 |
| JVM Initial Heap (MB): | 21000 |
| JVM Maximum Heap (MB): | 21000 |
| JVM Address Bits: | 64 |
| Boot Firmware Version: | I42 v2.00 (02/02/2019) |
| Management Firmware Version: | 1.40 Feb 05 2019 |
| Workload Version: | SSJ 1.2.10 |
| Director Location: | Controller |
| Other Software: | HPE Service Pack for ProLiant (SPP) - Version 2019.03.0 (Mar 2019) |
| JVM Instance | ssj_ops@100% |
|---|---|
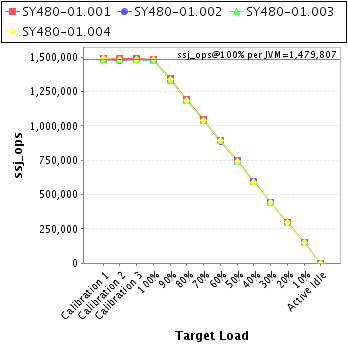
| SY480-01.001 | 1,484,840 |
| SY480-01.002 | 1,472,444 |
| SY480-01.003 | 1,478,440 |
| SY480-01.004 | 1,483,503 |
| ssj_ops@100% | 5,919,227 |
| ssj_ops@100% per JVM | 1,479,807 |
| Target Load | Actual Load | ssj_ops | |
|---|---|---|---|
| Target | Actual | ||
| Calibration 1 | 1,490,007 | ||
| Calibration 2 | 1,489,885 | ||
| Calibration 3 | 1,492,559 | ||
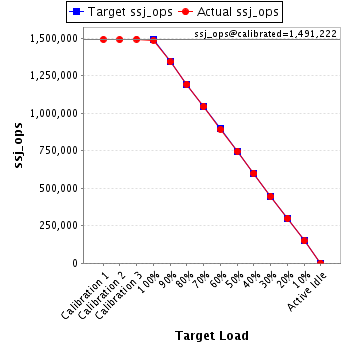
| ssj_ops@calibrated=1,491,222 | |||
| 100% | 99.6% | 1,491,222 | 1,484,840 |
| 90% | 90.0% | 1,342,100 | 1,341,688 |
| 80% | 79.9% | 1,192,977 | 1,191,306 |
| 70% | 70.0% | 1,043,855 | 1,043,713 |
| 60% | 59.8% | 894,733 | 892,129 |
| 50% | 50.0% | 745,611 | 745,078 |
| 40% | 40.1% | 596,489 | 598,108 |
| 30% | 29.9% | 447,367 | 445,200 |
| 20% | 20.0% | 298,244 | 298,689 |
| 10% | 10.0% | 149,122 | 149,113 |
| Active Idle | 0 | 0 | |
| Target Load | Actual Load | ssj_ops | |
|---|---|---|---|
| Target | Actual | ||
| Calibration 1 | 1,481,078 | ||
| Calibration 2 | 1,477,185 | ||
| Calibration 3 | 1,484,604 | ||
| ssj_ops@calibrated=1,480,894 | |||
| 100% | 99.4% | 1,480,894 | 1,472,444 |
| 90% | 90.2% | 1,332,805 | 1,335,826 |
| 80% | 80.0% | 1,184,715 | 1,184,295 |
| 70% | 70.2% | 1,036,626 | 1,038,991 |
| 60% | 60.0% | 888,537 | 887,960 |
| 50% | 49.8% | 740,447 | 737,692 |
| 40% | 40.0% | 592,358 | 591,862 |
| 30% | 30.0% | 444,268 | 444,453 |
| 20% | 20.0% | 296,179 | 296,231 |
| 10% | 10.0% | 148,089 | 148,250 |
| Active Idle | 0 | 0 | |

| Target Load | Actual Load | ssj_ops | |
|---|---|---|---|
| Target | Actual | ||
| Calibration 1 | 1,485,266 | ||
| Calibration 2 | 1,483,736 | ||
| Calibration 3 | 1,480,800 | ||
| ssj_ops@calibrated=1,482,268 | |||
| 100% | 99.7% | 1,482,268 | 1,478,440 |
| 90% | 89.9% | 1,334,041 | 1,333,083 |
| 80% | 79.8% | 1,185,814 | 1,183,586 |
| 70% | 69.9% | 1,037,587 | 1,035,570 |
| 60% | 60.0% | 889,361 | 889,860 |
| 50% | 50.0% | 741,134 | 741,177 |
| 40% | 40.1% | 592,907 | 593,887 |
| 30% | 30.0% | 444,680 | 443,949 |
| 20% | 20.0% | 296,454 | 296,058 |
| 10% | 10.0% | 148,227 | 148,146 |
| Active Idle | 0 | 0 | |

| Target Load | Actual Load | ssj_ops | |
|---|---|---|---|
| Target | Actual | ||
| Calibration 1 | 1,487,722 | ||
| Calibration 2 | 1,484,691 | ||
| Calibration 3 | 1,485,166 | ||
| ssj_ops@calibrated=1,484,928 | |||
| 100% | 99.9% | 1,484,928 | 1,483,503 |
| 90% | 90.0% | 1,336,435 | 1,337,120 |
| 80% | 79.9% | 1,187,943 | 1,186,670 |
| 70% | 70.1% | 1,039,450 | 1,040,634 |
| 60% | 60.1% | 890,957 | 892,317 |
| 50% | 49.9% | 742,464 | 741,558 |
| 40% | 39.8% | 593,971 | 590,296 |
| 30% | 29.9% | 445,478 | 444,627 |
| 20% | 20.0% | 296,986 | 297,256 |
| 10% | 10.1% | 148,493 | 150,137 |
| Active Idle | 0 | 0 | |
