
SPECpower_ssj2008
Host 'NODE02' Performance Report
Copyright © 2007-2018 Standard Performance Evaluation Corporation
| Hewlett Packard Enterprise Synergy 480 Gen10 Compute Module | ssj_ops@100% = 5,718,972 ssj_ops@100% per JVM = 1,429,743 |
||||
| Test Sponsor: | Hewlett Packard Enterprise | SPEC License #: | 3 | Test Method: | Multi Node |
| Tested By: | Hewlett Packard Enterprise | Test Location: | Houston, TX, USA | Test Date: | Apr 6, 2018 |
| Hardware Availability: | Jun-2018 | Software Availability: | Mar-2018 | Publication: | Apr 25, 2018 |
| System Source: | Single Supplier | System Designation: | Server | Power Provisioning: | Line-powered |
| Target Load | Actual Load | ssj_ops | |
|---|---|---|---|
| Target | Actual | ||
| Calibration 1 | 5,741,458 | ||
| Calibration 2 | 5,734,720 | ||
| Calibration 3 | 5,738,955 | ||
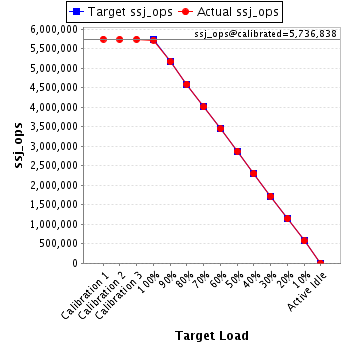
| ssj_ops@calibrated=5,736,838 | |||
| 100% | 99.7% | 5,736,838 | 5,718,972 |
| 90% | 90.1% | 5,163,154 | 5,167,148 |
| 80% | 79.9% | 4,589,470 | 4,585,342 |
| 70% | 69.8% | 4,015,786 | 4,004,035 |
| 60% | 60.0% | 3,442,103 | 3,442,578 |
| 50% | 50.0% | 2,868,419 | 2,869,189 |
| 40% | 40.0% | 2,294,735 | 2,294,359 |
| 30% | 30.0% | 1,721,051 | 1,723,146 |
| 20% | 20.0% | 1,147,368 | 1,145,008 |
| 10% | 10.0% | 573,684 | 573,153 |
| Active Idle | 0 | 0 | |
| Set Identifier: | SUT |
| Set Description: | System Under Test |
| # of Identical Nodes: | 12 |
| Comment: | SUT |
| Hardware | |
|---|---|
| Hardware Vendor: | Hewlett Packard Enterprise |
| Model: | Synergy 480 Gen10 Compute Module |
| Form Factor: | Other |
| CPU Name: | Intel Xeon Platinum 8180 2.50GHz |
| CPU Characteristics: | 28-Core, 2.50 GHz, 38.5 MB L3 Cache |
| CPU Frequency (MHz): | 2500 |
| CPU(s) Enabled: | 56 cores, 2 chips, 28 cores/chip |
| Hardware Threads: | 112 (2 / core) |
| CPU(s) Orderable: | 1,2 chips |
| Primary Cache: | 32 KB I + 32 KB D on chip per core |
| Secondary Cache: | 1 MB I+D on chip per core |
| Tertiary Cache: | 39424 KB I+D on chip per chip |
| Other Cache: | None |
| Memory Amount (GB): | 192 |
| # and size of DIMM: | 12 x 16384 MB |
| Memory Details: | 12 x 16GB 2Rx8 PC4-2666-V ECC; slots 1, 3, 5, 8, 10 and 12 populated on each CPU socket |
| Power Supply Quantity and Rating (W): | None |
| Power Supply Details: | Shared |
| Disk Drive: | 1 x HPE Synergy 480 Gen10 M.2 FIO Adapter Board Kit (873165-B21); 1 x HPE 480GB SATA 6G Read Intensive M.2 2280 SSD (875498-B21) |
| Disk Controller: | 1 x HPE Smart Array S100i SR Gen10 |
| # and type of Network Interface Cards (NICs) Installed: | 1 x HPE Synergy 3820C 10/20Gb 2-port Converged Network Adapter (777430-B21) |
| NICs Enabled in Firmware / OS / Connected: | 2/1/1 |
| Network Speed (Mbit): | 10000 |
| Keyboard: | None |
| Mouse: | None |
| Monitor: | None |
| Optical Drives: | No |
| Other Hardware: | None |
| Software | |
|---|---|
| Power Management: | Enabled (see SUT Notes) |
| Operating System (OS): | Windows Server 2012 R2 Datacenter |
| OS Version: | 6.3 (Build 9600) |
| Filesystem: | NTFS |
| JVM Vendor: | Oracle Corporation |
| JVM Version: | Java HotSpot(TM) 64-Bit Server VM (build 24.80-b11, mixed mode), version 1.7.0_80 |
| JVM Command-line Options: | -server -Xmn19g -Xms21g -Xmx21g -XX:SurvivorRatio=1 -XX:TargetSurvivorRatio=99 -XX:ParallelGCThreads=28 -XX:AllocatePrefetchDistance=256 -XX:AllocatePrefetchLines=4 -XX:LoopUnrollLimit=45 -XX:InitialTenuringThreshold=12 -XX:MaxTenuringThreshold=15 -XX:InlineSmallCode=9000 -XX:MaxInlineSize=270 -XX:FreqInlineSize=6000 -XX:+UseLargePages -XX:+UseParallelOldGC -XX:+AggressiveOpts |
| JVM Affinity: | start /NODE [0,1,2,3] /AFFINITY [0xFFFFFFF] |
| JVM Instances: | 4 |
| JVM Initial Heap (MB): | 21000 |
| JVM Maximum Heap (MB): | 21000 |
| JVM Address Bits: | 64 |
| Boot Firmware Version: | I42 v1.32 (02/01/2018) |
| Management Firmware Version: | 1.15 Aug 17 2017 |
| Workload Version: | SSJ 1.2.10 |
| Director Location: | Controller |
| Other Software: | HPE Composer Version 3.10.07 (HPE OneView) with HPE Synergy Custom SPP Bundle 2017.10.20180323; Microsoft Windows KB4054519, KB4056898 |
| JVM Instance | ssj_ops@100% |
|---|---|
| NODE02.001 | 1,439,289 |
| NODE02.002 | 1,422,351 |
| NODE02.003 | 1,429,335 |
| NODE02.004 | 1,427,997 |
| ssj_ops@100% | 5,718,972 |
| ssj_ops@100% per JVM | 1,429,743 |

| Target Load | Actual Load | ssj_ops | |
|---|---|---|---|
| Target | Actual | ||
| Calibration 1 | 1,445,863 | ||
| Calibration 2 | 1,446,184 | ||
| Calibration 3 | 1,443,969 | ||
| ssj_ops@calibrated=1,445,077 | |||
| 100% | 99.6% | 1,445,077 | 1,439,289 |
| 90% | 90.4% | 1,300,569 | 1,305,746 |
| 80% | 79.9% | 1,156,061 | 1,154,923 |
| 70% | 69.6% | 1,011,554 | 1,006,206 |
| 60% | 60.0% | 867,046 | 867,324 |
| 50% | 50.0% | 722,538 | 723,072 |
| 40% | 40.1% | 578,031 | 579,704 |
| 30% | 30.0% | 433,523 | 433,173 |
| 20% | 20.1% | 289,015 | 289,981 |
| 10% | 10.1% | 144,508 | 145,406 |
| Active Idle | 0 | 0 | |

| Target Load | Actual Load | ssj_ops | |
|---|---|---|---|
| Target | Actual | ||
| Calibration 1 | 1,428,411 | ||
| Calibration 2 | 1,428,559 | ||
| Calibration 3 | 1,427,434 | ||
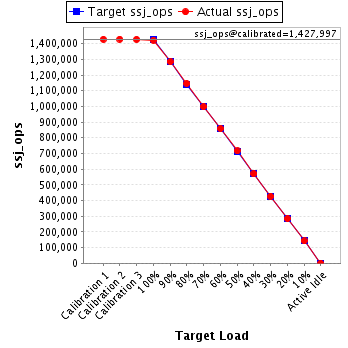
| ssj_ops@calibrated=1,427,997 | |||
| 100% | 99.6% | 1,427,997 | 1,422,351 |
| 90% | 89.9% | 1,285,197 | 1,284,210 |
| 80% | 80.3% | 1,142,397 | 1,146,949 |
| 70% | 69.9% | 999,598 | 997,677 |
| 60% | 60.1% | 856,798 | 857,965 |
| 50% | 50.1% | 713,998 | 715,704 |
| 40% | 39.9% | 571,199 | 569,500 |
| 30% | 29.9% | 428,399 | 427,019 |
| 20% | 19.9% | 285,599 | 283,468 |
| 10% | 10.0% | 142,800 | 142,230 |
| Active Idle | 0 | 0 | |
| Target Load | Actual Load | ssj_ops | |
|---|---|---|---|
| Target | Actual | ||
| Calibration 1 | 1,435,264 | ||
| Calibration 2 | 1,430,366 | ||
| Calibration 3 | 1,433,220 | ||
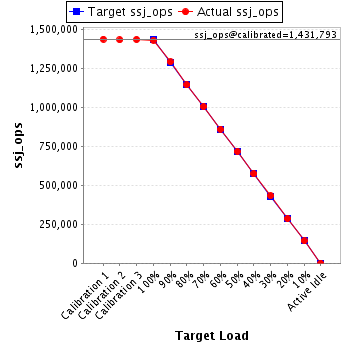
| ssj_ops@calibrated=1,431,793 | |||
| 100% | 99.8% | 1,431,793 | 1,429,335 |
| 90% | 90.1% | 1,288,614 | 1,289,553 |
| 80% | 79.8% | 1,145,435 | 1,142,765 |
| 70% | 70.1% | 1,002,255 | 1,003,523 |
| 60% | 60.0% | 859,076 | 859,090 |
| 50% | 50.0% | 715,897 | 715,937 |
| 40% | 40.0% | 572,717 | 572,503 |
| 30% | 30.1% | 429,538 | 431,310 |
| 20% | 19.9% | 286,359 | 285,297 |
| 10% | 10.0% | 143,179 | 143,150 |
| Active Idle | 0 | 0 | |
| Target Load | Actual Load | ssj_ops | |
|---|---|---|---|
| Target | Actual | ||
| Calibration 1 | 1,431,920 | ||
| Calibration 2 | 1,429,611 | ||
| Calibration 3 | 1,434,331 | ||
| ssj_ops@calibrated=1,431,971 | |||
| 100% | 99.7% | 1,431,971 | 1,427,997 |
| 90% | 89.9% | 1,288,774 | 1,287,639 |
| 80% | 79.7% | 1,145,577 | 1,140,705 |
| 70% | 69.6% | 1,002,380 | 996,629 |
| 60% | 59.9% | 859,183 | 858,198 |
| 50% | 49.9% | 715,985 | 714,476 |
| 40% | 40.0% | 572,788 | 572,652 |
| 30% | 30.1% | 429,591 | 431,643 |
| 20% | 20.0% | 286,394 | 286,263 |
| 10% | 9.9% | 143,197 | 142,368 |
| Active Idle | 0 | 0 | |
