SPECpower_ssj2008
Aggregate Performance Report
Copyright © 2007-2014 Standard Performance Evaluation Corporation
| Fujitsu FUJITSU Server PRIMERGY CX2550 M1 | ssj_ops@100% = 12,913,912 ssj_ops@100% per Host = 3,228,478 ssj_ops@100% per JVM = 89,680 |
||||
| Test Sponsor: | Fujitsu | SPEC License #: | 19 | Test Method: | Multi Node |
| Tested By: | Fujitsu | Test Location: | Paderborn, NRW, Germany | Test Date: | Nov 15, 2014 |
| Hardware Availability: | Dec-2014 | Software Availability: | Jun-2013 | Publication: | Dec 10, 2014 |
| System Source: | Single Supplier | System Designation: | Server | Power Provisioning: | Line-powered |
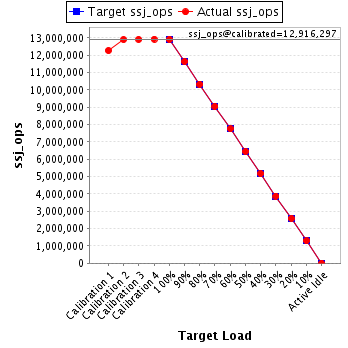
| Target Load | Actual Load | ssj_ops | |
|---|---|---|---|
| Target | Actual | ||
| Calibration 1 | 12,259,384 | ||
| Calibration 2 | 12,896,277 | ||
| Calibration 3 | 12,908,904 | ||
| Calibration 4 | 12,923,689 | ||
| ssj_ops@calibrated=12,916,297 | |||
| 100% | 100.0% | 12,916,297 | 12,913,912 |
| 90% | 90.0% | 11,624,667 | 11,626,095 |
| 80% | 80.0% | 10,333,037 | 10,327,585 |
| 70% | 70.1% | 9,041,408 | 9,048,447 |
| 60% | 60.0% | 7,749,778 | 7,752,149 |
| 50% | 49.9% | 6,458,148 | 6,449,897 |
| 40% | 40.0% | 5,166,519 | 5,168,294 |
| 30% | 30.0% | 3,874,889 | 3,878,894 |
| 20% | 20.0% | 2,583,259 | 2,586,185 |
| 10% | 10.0% | 1,291,630 | 1,293,707 |
| Active Idle | 0 | 0 | |
| # of Nodes | # of Chips | # of Cores | # of Threads | Total RAM (GB) | # of OS Images | # of JVM Instances |
|---|---|---|---|---|---|---|
| 4 | 8 | 144 | 288 | 256 | 4 | 144 |
| Set Identifier: | CX2550 M1 |
| Set Description: | System Under Test |
| # of Identical Nodes: | 4 |
| Comment: | Multi Node |
| Hardware per Node | |
|---|---|
| Hardware Vendor: | Fujitsu |
| Model: | FUJITSU Server PRIMERGY CX2550 M1 |
| Form Factor: | Blade |
| CPU Name: | Intel Xeon E5-2699 v3 |
| CPU Characteristics: | 18-Core, 2.30GHz, 45MB L3 Cache |
| CPU Frequency (MHz): | 2300 |
| CPU(s) Enabled: | 36 cores, 2 chips, 18 cores/chip |
| Hardware Threads: | 72 (2 / core) |
| CPU(s) Orderable: | 1,2 chips |
| Primary Cache: | 32 KB I + 32 KB D on chip per core |
| Secondary Cache: | 256 KB I+D on chip per core |
| Tertiary Cache: | 45 MB I+D on chip per chip |
| Other Cache: | None |
| Memory Amount (GB): | 64 |
| # and size of DIMM: | 8 x 8192 MB |
| Memory Details: | 8 GB DDR4, registered, ECC, 2133 MHz, PC4-2133R, DIMM, 2Rx8; slots 1A, 1B, 1C, 1D, 1E, 1F, 1G, 1H populated |
| Power Supply Quantity and Rating (W): | None |
| Power Supply Details: | N/A |
| Disk Drive: | 1 x SSD SATA 6G 64GB DOM N H-P, S26361-F5523-E64 |
| Disk Controller: | Integrated SATA Controller |
| # and type of Network Interface Cards (NICs) Installed: | 2 x Intel I350 Gigabit Network Connection (onboard) |
| NICs Enabled in Firmware / OS / Connected: | 1/1/1 |
| Network Speed (Mbit): | 1000 |
| Keyboard: | None |
| Mouse: | None |
| Monitor: | None |
| Optical Drives: | No |
| Other Hardware: | None |
| Software per Node | |
|---|---|
| Power Management: | Enabled ("Fujitsu Enhanced Power Settings" power plan) |
| Operating System (OS): | Microsoft Windows Server 2008 R2 Enterprise SP1 |
| OS Version: | Version 6.1.7601 Service Pack 1 Build 7601 |
| Filesystem: | NTFS |
| JVM Vendor: | IBM Corporation |
| JVM Version: | IBM J9 VM (build 2.6, JRE 1.7.0 Windows Server 2008 R2 amd64-64 20120322_106209 (JIT enabled, AOT enabled) |
| JVM Command-line Options: | -Xmn825m -Xms975m -Xmx975m -Xaggressive -Xcompressedrefs -Xgcpolicy:gencon -XlockReservation -Xnoloa -XtlhPrefetch -Xlp -Xconcurrentlevel0 -Xthr:minimizeusercpu -Xgcthreads2 (-Xgcthreads1 for JVM5 and JVM23) |
| JVM Affinity: | start /NODE [0,1,2,3] /AFFINITY [0x3,0xC,0x30,0xC0,0x300,0xC00,0x3000,0xC000,0x30000] |
| JVM Instances: | 36 |
| JVM Initial Heap (MB): | 975 |
| JVM Maximum Heap (MB): | 975 |
| JVM Address Bits: | 64 |
| Boot Firmware Version: | R1.7.0 |
| Management Firmware Version: | 7.64F |
| Workload Version: | SSJ 1.2.10 |
| Director Location: | Controller |
| Other Software: | IBM WebSphere Application Server V8.5.0.0, Microsoft Hotfix for Windows (KB2510206) |
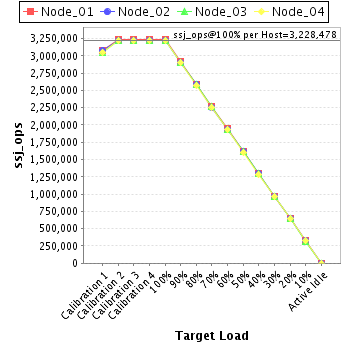
| Host | ssj_ops@100% |
|---|---|
| Node_01 | 3,238,142 |
| Node_02 | 3,225,889 |
| Node_03 | 3,226,411 |
| Node_04 | 3,223,470 |
| ssj_ops@100% | 12,913,912 |
| ssj_ops@100% per Host | 3,228,478 |
| ssj_ops@100% per JVM | 89,680 |
| Target Load | Actual Load | ssj_ops | |
|---|---|---|---|
| Target | Actual | ||
| Calibration 1 | 3,082,383 | ||
| Calibration 2 | 3,233,990 | ||
| Calibration 3 | 3,236,449 | ||
| Calibration 4 | 3,241,078 | ||
| ssj_ops@calibrated=3,238,763 | |||
| 100% | 100.0% | 3,238,763 | 3,238,142 |
| 90% | 90.1% | 2,914,887 | 2,919,126 |
| 80% | 79.8% | 2,591,011 | 2,583,246 |
| 70% | 70.2% | 2,267,134 | 2,274,175 |
| 60% | 60.0% | 1,943,258 | 1,943,082 |
| 50% | 50.0% | 1,619,382 | 1,618,490 |
| 40% | 40.0% | 1,295,505 | 1,296,825 |
| 30% | 30.0% | 971,629 | 970,994 |
| 20% | 20.0% | 647,753 | 648,713 |
| 10% | 10.1% | 323,876 | 325,509 |
| Active Idle | 0 | 0 | |

| Target Load | Actual Load | ssj_ops | |
|---|---|---|---|
| Target | Actual | ||
| Calibration 1 | 3,073,158 | ||
| Calibration 2 | 3,221,654 | ||
| Calibration 3 | 3,225,108 | ||
| Calibration 4 | 3,228,529 | ||
| ssj_ops@calibrated=3,226,819 | |||
| 100% | 100.0% | 3,226,819 | 3,225,889 |
| 90% | 90.0% | 2,904,137 | 2,902,629 |
| 80% | 80.0% | 2,581,455 | 2,581,718 |
| 70% | 69.9% | 2,258,773 | 2,257,036 |
| 60% | 60.0% | 1,936,091 | 1,937,693 |
| 50% | 49.9% | 1,613,409 | 1,610,750 |
| 40% | 40.0% | 1,290,727 | 1,292,208 |
| 30% | 30.0% | 968,046 | 967,509 |
| 20% | 20.0% | 645,364 | 646,139 |
| 10% | 10.0% | 322,682 | 323,987 |
| Active Idle | 0 | 0 | |
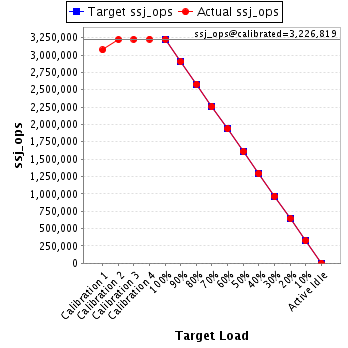
| Target Load | Actual Load | ssj_ops | |
|---|---|---|---|
| Target | Actual | ||
| Calibration 1 | 3,048,450 | ||
| Calibration 2 | 3,220,160 | ||
| Calibration 3 | 3,225,958 | ||
| Calibration 4 | 3,228,458 | ||
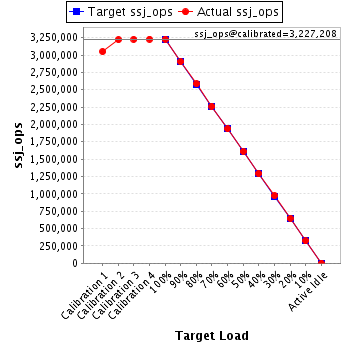
| ssj_ops@calibrated=3,227,208 | |||
| 100% | 100.0% | 3,227,208 | 3,226,411 |
| 90% | 90.0% | 2,904,487 | 2,903,508 |
| 80% | 80.1% | 2,581,766 | 2,585,250 |
| 70% | 70.0% | 2,259,046 | 2,260,194 |
| 60% | 60.0% | 1,936,325 | 1,935,511 |
| 50% | 50.0% | 1,613,604 | 1,612,667 |
| 40% | 40.0% | 1,290,883 | 1,291,008 |
| 30% | 30.1% | 968,162 | 971,738 |
| 20% | 20.0% | 645,442 | 646,716 |
| 10% | 10.0% | 322,721 | 321,463 |
| Active Idle | 0 | 0 | |
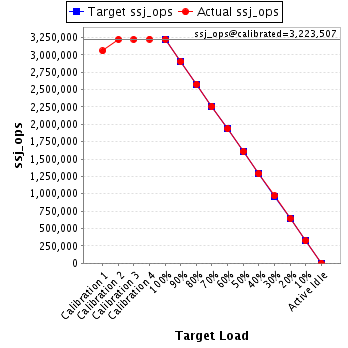
| Target Load | Actual Load | ssj_ops | |
|---|---|---|---|
| Target | Actual | ||
| Calibration 1 | 3,055,393 | ||
| Calibration 2 | 3,220,472 | ||
| Calibration 3 | 3,221,389 | ||
| Calibration 4 | 3,225,624 | ||
| ssj_ops@calibrated=3,223,507 | |||
| 100% | 100.0% | 3,223,507 | 3,223,470 |
| 90% | 90.0% | 2,901,156 | 2,900,832 |
| 80% | 80.0% | 2,578,805 | 2,577,372 |
| 70% | 70.0% | 2,256,455 | 2,257,042 |
| 60% | 60.1% | 1,934,104 | 1,935,864 |
| 50% | 49.9% | 1,611,753 | 1,607,990 |
| 40% | 40.0% | 1,289,403 | 1,288,253 |
| 30% | 30.0% | 967,052 | 968,653 |
| 20% | 20.0% | 644,701 | 644,617 |
| 10% | 10.0% | 322,351 | 322,747 |
| Active Idle | 0 | 0 | |