SPECpower_ssj2008
Aggregate Performance Report
Copyright © 2007-2011 Standard Performance Evaluation Corporation
| Acer Incorporated Acer AW2000h-AW170h F1 | ssj_ops@100% = 3,719,937 ssj_ops@100% per Host = 929,984 ssj_ops@100% per JVM = 154,997 |
||||
| Test Sponsor: | Acer Incorporated | SPEC License #: | 97 | Test Method: | Multi Node |
| Tested By: | Acer Incorporated | Test Location: | Taipei, R.O.C. | Test Date: | Various |
| Hardware Availability: | Feb-2011 | Software Availability: | Dec-2009 | Publication: | Apr 7, 2011 |
| System Source: | Single Supplier | System Designation: | Server | Power Provisioning: | Line-powered |
| Target Load | Actual Load | ssj_ops | |
|---|---|---|---|
| Target | Actual | ||
| Calibration 1 | 3,732,149 | ||
| Calibration 2 | 3,737,032 | ||
| Calibration 3 | 3,732,640 | ||
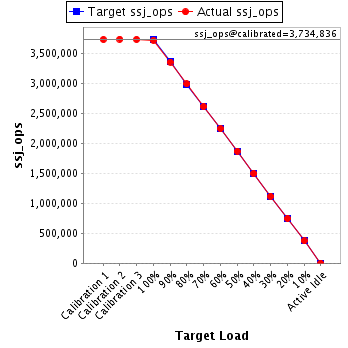
| ssj_ops@calibrated=3,734,836 | |||
| 100% | 99.6% | 3,734,836 | 3,719,937 |
| 90% | 89.9% | 3,361,352 | 3,356,241 |
| 80% | 80.1% | 2,987,869 | 2,991,178 |
| 70% | 70.0% | 2,614,385 | 2,614,290 |
| 60% | 60.0% | 2,240,901 | 2,242,718 |
| 50% | 50.1% | 1,867,418 | 1,871,046 |
| 40% | 40.0% | 1,493,934 | 1,495,531 |
| 30% | 29.9% | 1,120,451 | 1,117,336 |
| 20% | 20.0% | 746,967 | 745,742 |
| 10% | 10.0% | 373,484 | 373,653 |
| Active Idle | 0 | 0 | |
| # of Nodes | # of Chips | # of Cores | # of Threads | Total RAM (GB) | # of OS Images | # of JVM Instances |
|---|---|---|---|---|---|---|
| 4 | 8 | 48 | 96 | 96.0 | 4 | 24 |
| Set Identifier: | sut |
| Set Description: | System Under Test |
| # of Identical Nodes: | 4 |
| Comment: | None |
| Hardware per Node | |
|---|---|
| Hardware Vendor: | Acer Incorporated |
| Model: | Acer AW2000h-AW170h F1 |
| Form Factor: | 2U |
| CPU Name: | Intel Xeon X5675 |
| CPU Characteristics: | Six-Core, 3.07 GHz, 12 MB L3 cache |
| CPU Frequency (MHz): | 3067 |
| CPU(s) Enabled: | 12 cores, 2 chips, 6 cores/chip |
| Hardware Threads: | 24 (2 / core) |
| CPU(s) Orderable: | 1,2 chips |
| Primary Cache: | 32 KB I + 32 KB D on chip per core |
| Secondary Cache: | 256 KB I+D on chip per core |
| Tertiary Cache: | 12 MB I+D on chip per chip |
| Other Cache: | None |
| Memory Amount (GB): | 24 |
| # and size of DIMM: | 6 x 4096 MB |
| Memory Details: | 4GB 2Rx8 PC3-10600E; slots 1A, 2A, and 3A populated on each processor |
| Power Supply Quantity and Rating (W): | None |
| Power Supply Details: | Shared |
| Disk Drive: | 1 x 500GB SATA 3.5" HDD, Acer part #KH.500W8.019 |
| Disk Controller: | Integrated SATA controller |
| # and type of Network Interface Cards (NICs) Installed: | 2 x Intel 82576 Gigabit Ethernet |
| NICs Enabled in Firmware / OS / Connected: | 2/2/1 |
| Network Speed (Mbit): | 1000 |
| Keyboard: | USB |
| Mouse: | USB |
| Monitor: | Direct |
| Optical Drives: | No |
| Other Hardware: | None |
| Software per Node | |
|---|---|
| Power Management: | Power save enabled in OS |
| Operating System (OS): | Windows Server 2008, Enterprise Edition |
| OS Version: | R2 |
| Filesystem: | NTFS |
| JVM Vendor: | IBM Corporation |
| JVM Version: | IBM J9 VM (build 2.4, JRE 1.6.0 IBM J9 2.4 Windows Server 2008 amd64-64 jvmwa6460sr7-20091214_49398 (JIT enabled, AOT enabled) |
| JVM Command-line Options: | -Xmn1550m -Xms1950m -Xmx1950m -Xaggressive -Xcompressedrefs -Xgcpolicy:gencon -XlockReservation -Xnoloa -XtlhPrefetch -Xlp |
| JVM Affinity: | start /affinity [0xF, 0xF0, 0xF00,0xF000, 0xF0000, 0xF00000] |
| JVM Instances: | 6 |
| JVM Initial Heap (MB): | 1950 |
| JVM Maximum Heap (MB): | 1950 |
| JVM Address Bits: | 64 |
| Boot Firmware Version: | P08 |
| Management Firmware Version: | 1.20 |
| Workload Version: | SSJ 1.2.6 |
| Director Location: | Controller |
| Other Software: | None |
| Host | ssj_ops@100% |
|---|---|
| WIN-8T20LUSKNOV | 927,129 |
| WIN-R61MSQUQQU7 | 933,885 |
| WIN-TDM3C83C35P | 925,700 |
| WIN-ULK8O9BFFGJ | 933,223 |
| ssj_ops@100% | 3,719,937 |
| ssj_ops@100% per Host | 929,984 |
| ssj_ops@100% per JVM | 154,997 |

| Target Load | Actual Load | ssj_ops | |
|---|---|---|---|
| Target | Actual | ||
| Calibration 1 | 932,122 | ||
| Calibration 2 | 930,880 | ||
| Calibration 3 | 930,325 | ||
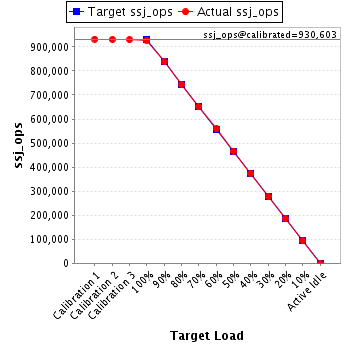
| ssj_ops@calibrated=930,603 | |||
| 100% | 99.6% | 930,603 | 927,129 |
| 90% | 90.0% | 837,543 | 837,798 |
| 80% | 79.9% | 744,482 | 743,732 |
| 70% | 70.0% | 651,422 | 651,139 |
| 60% | 60.2% | 558,362 | 560,378 |
| 50% | 50.2% | 465,301 | 466,953 |
| 40% | 40.1% | 372,241 | 372,937 |
| 30% | 30.0% | 279,181 | 278,748 |
| 20% | 19.8% | 186,121 | 184,651 |
| 10% | 10.0% | 93,060 | 93,337 |
| Active Idle | 0 | 0 | |
| Target Load | Actual Load | ssj_ops | |
|---|---|---|---|
| Target | Actual | ||
| Calibration 1 | 935,769 | ||
| Calibration 2 | 936,245 | ||
| Calibration 3 | 935,384 | ||
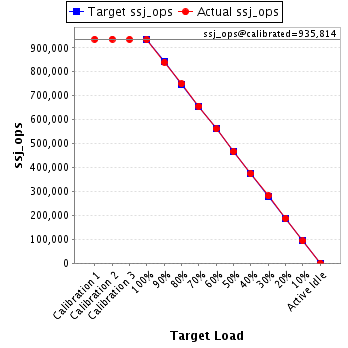
| ssj_ops@calibrated=935,814 | |||
| 100% | 99.8% | 935,814 | 933,885 |
| 90% | 89.7% | 842,233 | 839,862 |
| 80% | 80.1% | 748,651 | 749,417 |
| 70% | 70.1% | 655,070 | 656,129 |
| 60% | 60.0% | 561,488 | 561,526 |
| 50% | 49.8% | 467,907 | 466,224 |
| 40% | 39.9% | 374,326 | 373,653 |
| 30% | 30.1% | 280,744 | 281,227 |
| 20% | 20.1% | 187,163 | 187,791 |
| 10% | 9.9% | 93,581 | 93,037 |
| Active Idle | 0 | 0 | |
| Target Load | Actual Load | ssj_ops | |
|---|---|---|---|
| Target | Actual | ||
| Calibration 1 | 929,821 | ||
| Calibration 2 | 932,275 | ||
| Calibration 3 | 931,461 | ||
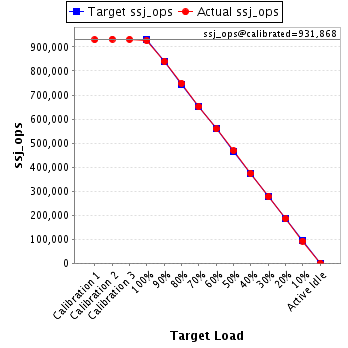
| ssj_ops@calibrated=931,868 | |||
| 100% | 99.3% | 931,868 | 925,700 |
| 90% | 90.1% | 838,681 | 839,942 |
| 80% | 80.3% | 745,495 | 748,677 |
| 70% | 69.9% | 652,308 | 651,695 |
| 60% | 60.0% | 559,121 | 559,211 |
| 50% | 50.2% | 465,934 | 468,253 |
| 40% | 40.1% | 372,747 | 373,588 |
| 30% | 29.8% | 279,560 | 277,325 |
| 20% | 19.9% | 186,374 | 185,346 |
| 10% | 9.9% | 93,187 | 92,517 |
| Active Idle | 0 | 0 | |
| Target Load | Actual Load | ssj_ops | |
|---|---|---|---|
| Target | Actual | ||
| Calibration 1 | 934,437 | ||
| Calibration 2 | 937,631 | ||
| Calibration 3 | 935,470 | ||
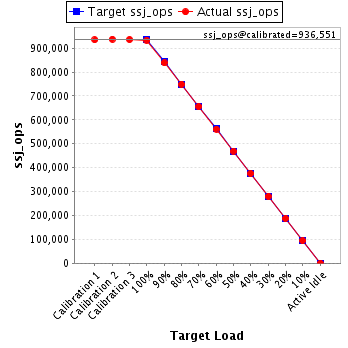
| ssj_ops@calibrated=936,551 | |||
| 100% | 99.6% | 936,551 | 933,223 |
| 90% | 89.5% | 842,895 | 838,639 |
| 80% | 80.0% | 749,240 | 749,352 |
| 70% | 70.0% | 655,585 | 655,327 |
| 60% | 60.0% | 561,930 | 561,604 |
| 50% | 50.1% | 468,275 | 469,616 |
| 40% | 40.1% | 374,620 | 375,353 |
| 30% | 29.9% | 280,965 | 280,037 |
| 20% | 20.1% | 187,310 | 187,954 |
| 10% | 10.1% | 93,655 | 94,762 |
| Active Idle | 0 | 0 | |