SPECpower_ssj2008
Aggregate Performance Report
Copyright © 2007-2010 Standard Performance Evaluation Corporation
| IBM Corporation IBM System x iDataPlex dx360 M3 | ssj_ops@100% = 1,471,188 ssj_ops@100% per Host = 735,594 ssj_ops@100% per JVM = 122,599 |
||||
| Test Sponsor: | IBM Corporation | SPEC License #: | 11 | Test Method: | Multi Node |
| Tested By: | IBM Corporation | Test Location: | Nankang, Taipei, Taiwan | Test Date: | May 14, 2010 |
| Hardware Availability: | Aug-2010 | Software Availability: | Oct-2009 | Publication: | Jun 2, 2010 |
| System Source: | Single Supplier | System Designation: | Server | Power Provisioning: | Line-powered |
| Target Load | Actual Load | ssj_ops | |
|---|---|---|---|
| Target | Actual | ||
| Calibration 1 | 1,470,957 | ||
| Calibration 2 | 1,479,544 | ||
| Calibration 3 | 1,477,949 | ||
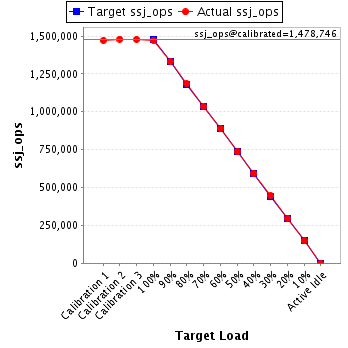
| ssj_ops@calibrated=1,478,746 | |||
| 100% | 99.5% | 1,478,746 | 1,471,188 |
| 90% | 90.0% | 1,330,872 | 1,330,272 |
| 80% | 80.2% | 1,182,997 | 1,185,339 |
| 70% | 70.0% | 1,035,122 | 1,034,599 |
| 60% | 60.1% | 887,248 | 889,397 |
| 50% | 49.9% | 739,373 | 737,173 |
| 40% | 40.1% | 591,499 | 592,285 |
| 30% | 30.1% | 443,624 | 444,563 |
| 20% | 20.0% | 295,749 | 296,000 |
| 10% | 10.0% | 147,875 | 148,111 |
| Active Idle | 0 | 0 | |
| # of Nodes | # of Chips | # of Cores | # of Threads | Total RAM (GB) | # of OS Images | # of JVM Instances |
|---|---|---|---|---|---|---|
| 2 | 4 | 24 | 48 | 24.0 | 2 | 12 |
| Set Identifier: | sut |
| Set Description: | System Under Test |
| # of Identical Nodes: | 2 |
| Comment: | Here is a comment for this set. |
| Hardware per Node | |
|---|---|
| Hardware Vendor: | IBM Corporation |
| Model: | IBM System x iDataPlex dx360 M3 |
| Form Factor: | 2U |
| CPU Name: | Intel Xeon L5640 |
| CPU Characteristics: | Six-Core, 2.26GHz, 12MB L3 Cache |
| CPU Frequency (MHz): | 2267 |
| CPU(s) Enabled: | 12 cores, 2 chips, 6 cores/chip |
| Hardware Threads: | 24 (2 / core) |
| CPU(s) Orderable: | 1,2 chips |
| Primary Cache: | 32 KB I + 32 KB D on chip per core |
| Secondary Cache: | 256 KB I+D on chip per core |
| Tertiary Cache: | 12 MB I+D on chip per chip |
| Other Cache: | None |
| Memory Amount (GB): | 12 |
| # and size of DIMM: | 6 x 2048 MB |
| Memory Details: | 2GB 2Rx8 PC3L-10600R; slots 3, 6, 8, 11, 14, and 16 populated |
| Power Supply Quantity and Rating (W): | None |
| Power Supply Details: | Shared |
| Disk Drive: | 1 x 50 GB SATA SSD, feature code 5197 |
| Disk Controller: | Integrated SATA controller |
| # and type of Network Interface Cards (NICs) Installed: | 2 x Integrated Intel 82575 Gigabit Ethernet Controller |
| NICs Enabled in Firmware / OS / Connected: | 1/1/1 |
| Network Speed (Mbit): | 1000 |
| Keyboard: | KVM |
| Mouse: | KVM |
| Monitor: | KVM |
| Optical Drives: | No |
| Other Hardware: | None |
| Software per Node | |
|---|---|
| Power Management: | Power saver plan in OS |
| Operating System (OS): | Microsoft Windows Server 2008 x64 Datacenter Edition |
| OS Version: | R2 |
| Filesystem: | NTFS |
| JVM Vendor: | IBM Corporation |
| JVM Version: | IBM J9 VM (build pwa6460sr5-20090529_04(SR5)) |
| JVM Command-line Options: | -Xaggressive -Xcompressedrefs -Xgcpolicy:gencon -Xmn1100m -Xms1500m -Xmx1500m -XlockReservation -Xnoloa -XtlhPrefetch -Xlp |
| JVM Affinity: | start /affinity [F,F0,F00,F000,F0000,F00000] |
| JVM Instances: | 6 |
| JVM Initial Heap (MB): | 1500 |
| JVM Maximum Heap (MB): | 1500 |
| JVM Address Bits: | 64 |
| Boot Firmware Version: | TME148T |
| Management Firmware Version: | YUOO71A |
| Workload Version: | SSJ 1.2.6 |
| Director Location: | Controller |
| Other Software: | None |
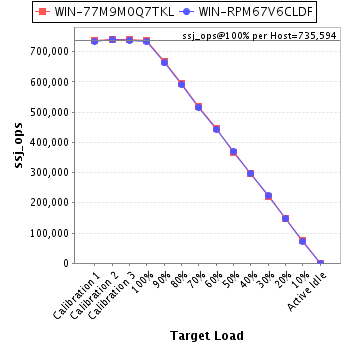
| Host | ssj_ops@100% |
|---|---|
| WIN-77M9M0Q7TKL | 738,163 |
| WIN-RPM67V6CLDF | 733,025 |
| ssj_ops@100% | 1,471,188 |
| ssj_ops@100% per Host | 735,594 |
| ssj_ops@100% per JVM | 122,599 |
| Target Load | Actual Load | ssj_ops | |
|---|---|---|---|
| Target | Actual | ||
| Calibration 1 | 736,859 | ||
| Calibration 2 | 741,117 | ||
| Calibration 3 | 739,722 | ||
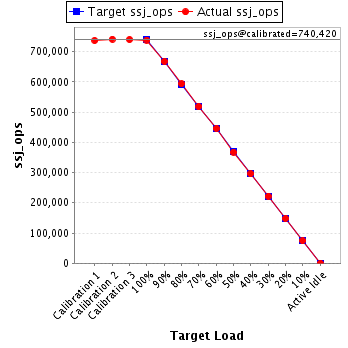
| ssj_ops@calibrated=740,420 | |||
| 100% | 99.7% | 740,420 | 738,163 |
| 90% | 90.2% | 666,378 | 667,854 |
| 80% | 80.1% | 592,336 | 593,387 |
| 70% | 70.0% | 518,294 | 518,439 |
| 60% | 60.2% | 444,252 | 445,962 |
| 50% | 49.7% | 370,210 | 367,873 |
| 40% | 39.9% | 296,168 | 295,739 |
| 30% | 30.0% | 222,126 | 222,018 |
| 20% | 20.1% | 148,084 | 148,637 |
| 10% | 10.1% | 74,042 | 74,614 |
| Active Idle | 0 | 0 | |
| Target Load | Actual Load | ssj_ops | |
|---|---|---|---|
| Target | Actual | ||
| Calibration 1 | 734,098 | ||
| Calibration 2 | 738,427 | ||
| Calibration 3 | 738,227 | ||
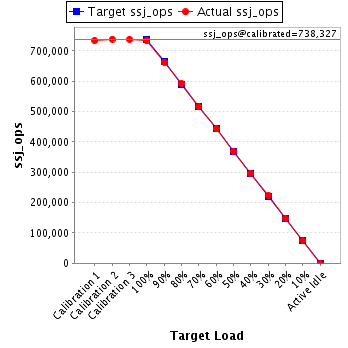
| ssj_ops@calibrated=738,327 | |||
| 100% | 99.3% | 738,327 | 733,025 |
| 90% | 89.7% | 664,494 | 662,418 |
| 80% | 80.2% | 590,661 | 591,953 |
| 70% | 69.9% | 516,829 | 516,160 |
| 60% | 60.1% | 442,996 | 443,435 |
| 50% | 50.0% | 369,163 | 369,300 |
| 40% | 40.2% | 295,331 | 296,546 |
| 30% | 30.1% | 221,498 | 222,546 |
| 20% | 20.0% | 147,665 | 147,363 |
| 10% | 10.0% | 73,833 | 73,497 |
| Active Idle | 0 | 0 | |