SPECpower_ssj2008
Aggregate Performance Report
Copyright © 2007-2010 Standard Performance Evaluation Corporation
| Hewlett-Packard Company ProLiant SL2X170z G6 | ssj_ops@100% = 3,417,531 ssj_ops@100% per Host = 854,383 ssj_ops@100% per JVM = 142,397 |
||||
| Test Sponsor: | Hewlett-Packard Company | SPEC License #: | 3 | Test Method: | Multi Node |
| Tested By: | Hewlett-Packard Company | Test Location: | Houston, TX, USA | Test Date: | Apr 6, 2010 |
| Hardware Availability: | Jun-2010 | Software Availability: | Sep-2009 | Publication: | Apr 21, 2010 |
| System Source: | Single Supplier | System Designation: | Server | Power Provisioning: | Line-powered |
| Target Load | Actual Load | ssj_ops | |
|---|---|---|---|
| Target | Actual | ||
| Calibration 1 | 3,418,867 | ||
| Calibration 2 | 3,430,177 | ||
| Calibration 3 | 3,432,622 | ||
| ssj_ops@calibrated=3,431,400 | |||
| 100% | 99.6% | 3,431,400 | 3,417,531 |
| 90% | 90.0% | 3,088,260 | 3,089,214 |
| 80% | 80.0% | 2,745,120 | 2,745,590 |
| 70% | 70.0% | 2,401,980 | 2,403,210 |
| 60% | 60.2% | 2,058,840 | 2,065,033 |
| 50% | 50.0% | 1,715,700 | 1,716,434 |
| 40% | 40.0% | 1,372,560 | 1,371,435 |
| 30% | 29.9% | 1,029,420 | 1,027,604 |
| 20% | 19.9% | 686,280 | 683,596 |
| 10% | 10.0% | 343,140 | 342,961 |
| Active Idle | 0 | 0 | |

| # of Nodes | # of Chips | # of Cores | # of Threads | Total RAM (GB) | # of OS Images | # of JVM Instances |
|---|---|---|---|---|---|---|
| 4 | 8 | 48 | 96 | 64.0 | 4 | 24 |
| Set Identifier: | sut |
| Set Description: | ProLiant SL2x170z G6 |
| # of Identical Nodes: | 4 |
| Comment: | None |
| Hardware per Node | |
|---|---|
| Hardware Vendor: | Hewlett-Packard Company |
| Model: | ProLiant SL2X170z G6 |
| Form Factor: | 1U |
| CPU Name: | Intel Xeon X5670 |
| CPU Characteristics: | Six-Core, 2.93 GHz, 12 MB L3 cache |
| CPU Frequency (MHz): | 2933 |
| CPU(s) Enabled: | 12 cores, 2 chips, 6 cores/chip |
| Hardware Threads: | 24 (2 / core) |
| CPU(s) Orderable: | 1,2 chips |
| Primary Cache: | 32 KB I + 32 KB D on chip per core |
| Secondary Cache: | 256 MB I+D on chip per chip |
| Tertiary Cache: | 8 MB I+D off chip per chip |
| Other Cache: | None |
| Memory Amount (GB): | 16 |
| # and size of DIMM: | 4 x 4096 MB |
| Memory Details: | 4GB PC3LV-10600E; slots 1 and 4 are populated on each processor |
| Power Supply Quantity and Rating (W): | None |
| Power Supply Details: | Shared |
| Disk Drive: | 1 x 60GB 3G SATA 2.5in QR MDL SSD, HP part #586585-B21 |
| Disk Controller: | Integrated SATA |
| # and type of Network Interface Cards (NICs) Installed: | 1 x NC382i Dual Port Multifunction Gigabit Server Adapters |
| NICs Enabled in Firmware / OS / Connected: | 2/2/1 |
| Network Speed (Mbit): | 1000 |
| Keyboard: | None |
| Mouse: | None |
| Monitor: | None |
| Optical Drives: | No |
| Other Hardware: | None |
| Software per Node | |
|---|---|
| Power Management: | Power Saver in OS |
| Operating System (OS): | Windows Server 2008, Enterprise Edition |
| OS Version: | R2 |
| Filesystem: | NTFS |
| JVM Vendor: | IBM Corporation |
| JVM Version: | IBM J9 VM (build 2.4, J2RE 1.6.0 IBM J9 2.4 Windows Server 2008 amd64-64 jvmwa660sr5-20090519_35743 (JIT enabled, AOT enabled) |
| JVM Command-line Options: | -Xaggressive -Xcompressedrefs -Xgcpolicy:gencon -Xmn1500m -Xms1900m -Xmx1900m -XlockReservation -Xnoloa -XtlhPrefetch -Xlp |
| JVM Affinity: | start /affinity [0xF, 0xF0, 0xF00, 0xF000, 0xF0000, 0xF00000] |
| JVM Instances: | 6 |
| JVM Initial Heap (MB): | 1900 |
| JVM Maximum Heap (MB): | 1900 |
| JVM Address Bits: | 64 |
| Boot Firmware Version: | O34 04/02/2010 |
| Management Firmware Version: | 4.20 1/13/10 |
| Workload Version: | SSJ 1.2.6 |
| Director Location: | Controller |
| Other Software: | None |
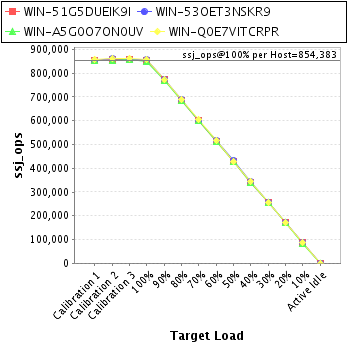
| Host | ssj_ops@100% |
|---|---|
| WIN-51G5DUEIK9I | 852,750 |
| WIN-53OET3NSKR9 | 855,877 |
| WIN-A5G0O7ON0UV | 850,870 |
| WIN-Q0E7VITCRPR | 858,033 |
| ssj_ops@100% | 3,417,531 |
| ssj_ops@100% per Host | 854,383 |
| ssj_ops@100% per JVM | 142,397 |
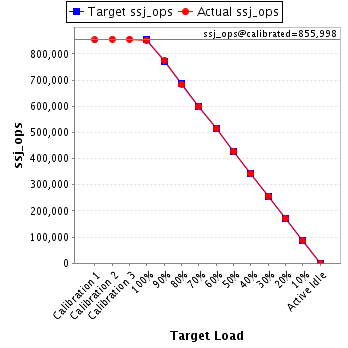
| Target Load | Actual Load | ssj_ops | |
|---|---|---|---|
| Target | Actual | ||
| Calibration 1 | 852,920 | ||
| Calibration 2 | 855,995 | ||
| Calibration 3 | 856,000 | ||
| ssj_ops@calibrated=855,998 | |||
| 100% | 99.6% | 855,998 | 852,750 |
| 90% | 90.4% | 770,398 | 773,572 |
| 80% | 79.9% | 684,798 | 683,962 |
| 70% | 70.0% | 599,198 | 599,036 |
| 60% | 60.1% | 513,599 | 514,635 |
| 50% | 50.1% | 427,999 | 428,431 |
| 40% | 40.0% | 342,399 | 342,073 |
| 30% | 30.0% | 256,799 | 256,743 |
| 20% | 19.9% | 171,200 | 169,943 |
| 10% | 10.1% | 85,600 | 86,205 |
| Active Idle | 0 | 0 | |
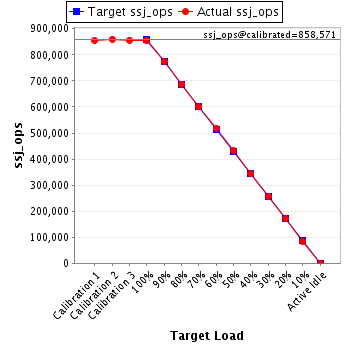
| Target Load | Actual Load | ssj_ops | |
|---|---|---|---|
| Target | Actual | ||
| Calibration 1 | 855,145 | ||
| Calibration 2 | 860,195 | ||
| Calibration 3 | 856,948 | ||
| ssj_ops@calibrated=858,571 | |||
| 100% | 99.7% | 858,571 | 855,877 |
| 90% | 90.1% | 772,714 | 773,650 |
| 80% | 80.1% | 686,857 | 687,987 |
| 70% | 69.9% | 601,000 | 600,135 |
| 60% | 60.4% | 515,143 | 518,290 |
| 50% | 50.2% | 429,286 | 431,003 |
| 40% | 39.9% | 343,429 | 342,670 |
| 30% | 30.0% | 257,571 | 257,585 |
| 20% | 20.0% | 171,714 | 171,453 |
| 10% | 9.9% | 85,857 | 85,319 |
| Active Idle | 0 | 0 | |
| Target Load | Actual Load | ssj_ops | |
|---|---|---|---|
| Target | Actual | ||
| Calibration 1 | 851,521 | ||
| Calibration 2 | 853,535 | ||
| Calibration 3 | 856,325 | ||
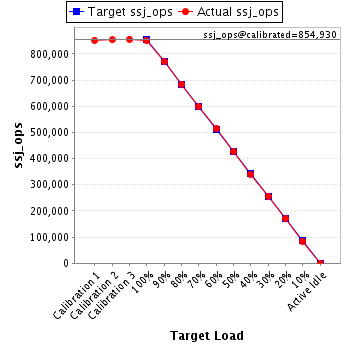
| ssj_ops@calibrated=854,930 | |||
| 100% | 99.5% | 854,930 | 850,870 |
| 90% | 90.1% | 769,437 | 770,255 |
| 80% | 80.0% | 683,944 | 684,339 |
| 70% | 70.1% | 598,451 | 599,072 |
| 60% | 60.1% | 512,958 | 513,775 |
| 50% | 50.1% | 427,465 | 428,138 |
| 40% | 39.9% | 341,972 | 341,088 |
| 30% | 30.0% | 256,479 | 256,729 |
| 20% | 19.9% | 170,986 | 170,513 |
| 10% | 9.9% | 85,493 | 85,060 |
| Active Idle | 0 | 0 | |
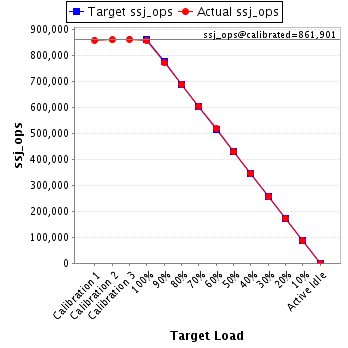
| Target Load | Actual Load | ssj_ops | |
|---|---|---|---|
| Target | Actual | ||
| Calibration 1 | 859,281 | ||
| Calibration 2 | 860,452 | ||
| Calibration 3 | 863,349 | ||
| ssj_ops@calibrated=861,901 | |||
| 100% | 99.6% | 861,901 | 858,033 |
| 90% | 89.5% | 775,710 | 771,736 |
| 80% | 80.0% | 689,520 | 689,303 |
| 70% | 70.2% | 603,330 | 604,967 |
| 60% | 60.1% | 517,140 | 518,333 |
| 50% | 49.8% | 430,950 | 428,862 |
| 40% | 40.1% | 344,760 | 345,604 |
| 30% | 29.8% | 258,570 | 256,547 |
| 20% | 19.9% | 172,380 | 171,686 |
| 10% | 10.0% | 86,190 | 86,376 |
| Active Idle | 0 | 0 | |
