SPECpower_ssj2008
Host 'BL280G6-16' Performance Report
Copyright © 2007-2009 Standard Performance Evaluation Corporation
| Hewlett-Packard Company ProLiant BL280c G6 | ssj_ops@100% = 451,775 ssj_ops@100% per JVM = 112,944 |
||||
| Test Sponsor: | Hewlett-Packard Company | SPEC License #: | 3 | Test Method: | Multi Node |
| Tested By: | Hewlett-Packard Company | Test Location: | Houston, TX, USA | Test Date: | Jun 25, 2009 |
| Hardware Availability: | Aug-2009 | Software Availability: | Aug-2009 | Publication: | Jul 15, 2009 |
| System Source: | Single Supplier | System Designation: | Server | Power Provisioning: | Line-powered |
| Target Load | Actual Load | ssj_ops | |
|---|---|---|---|
| Target | Actual | ||
| Calibration 1 | 446,319 | ||
| Calibration 2 | 452,273 | ||
| Calibration 3 | 452,720 | ||
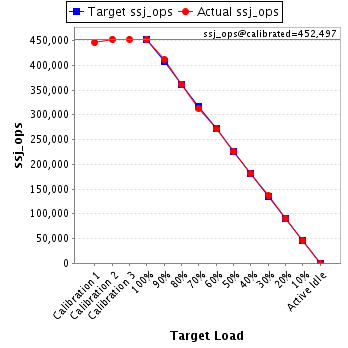
| ssj_ops@calibrated=452,497 | |||
| 100% | 99.8% | 452,497 | 451,775 |
| 90% | 91.0% | 407,247 | 411,919 |
| 80% | 80.0% | 361,997 | 361,949 |
| 70% | 69.2% | 316,748 | 313,076 |
| 60% | 60.0% | 271,498 | 271,310 |
| 50% | 49.9% | 226,248 | 225,989 |
| 40% | 40.1% | 180,999 | 181,420 |
| 30% | 30.2% | 135,749 | 136,655 |
| 20% | 19.9% | 90,499 | 89,830 |
| 10% | 10.1% | 45,250 | 45,684 |
| Active Idle | 0 | 0 | |
| Set Identifier: | sut |
| Set Description: | System Under Test |
| # of Identical Nodes: | 16 |
| Comment: | None |
| Hardware | |
|---|---|
| Hardware Vendor: | Hewlett-Packard Company |
| Model: | ProLiant BL280c G6 |
| Form Factor: | Blade |
| CPU Name: | Intel Xeon L5520 |
| CPU Characteristics: | 2.27GHz, 8 MB L3, 1333 MHz system bus |
| CPU Frequency (MHz): | 2267 |
| CPU(s) Enabled: | 8 cores, 2 chips, 4 cores/chip |
| Hardware Threads: | 16 (2 / core) |
| CPU(s) Orderable: | 1,2 chips |
| Primary Cache: | 32 KB I + 32 KB D on chip per core |
| Secondary Cache: | 256 KB I+D on chip per core |
| Tertiary Cache: | 8 MB I+D on chip per chip |
| Other Cache: | None |
| Memory Amount (GB): | 8.0 |
| # and size of DIMM: | 4 x 2048 MB |
| Memory Details: | PC3-10600E; Slots 2A and 4B populated on each CPU node |
| Power Supply Quantity and Rating (W): | None |
| Power Supply Details: | Shared |
| Disk Drive: | 1 x 32 GB SSD 2.5" SATA; HP part #461201-B21 |
| Disk Controller: | Integrated SATA controller |
| # and type of Network Interface Cards (NICs) Installed: | 2 x NC362i |
| NICs Enabled in Firmware / OS / Connected: | 2/2/1 |
| Network Speed (Mbit): | 1000 |
| Keyboard: | None |
| Mouse: | None |
| Monitor: | None |
| Optical Drives: | No |
| Other Hardware: | None |
| Software | |
|---|---|
| Power Management: | Enabled (see SUT Notes) |
| Operating System (OS): | Microsoft Windows Server 2008 x64 Enterprise Edition |
| OS Version: | Service Pack 2 |
| Filesystem: | NTFS |
| JVM Vendor: | Oracle Corporation |
| JVM Version: | Oracle JRockit(R) (build P28.0.0-29-114096-1.6.0_11-20090427-1759-windows-x86_64, compiled mode) |
| JVM Command-line Options: | -Xms1650m -Xmx1650m -Xns1500m -XXaggressive -XlargePages -XXthroughputCompaction -XXcallprofiling -XXlazyUnlocking -Xgc:genpar -XXgcthreads:4 -XXtlasize:min=12k,preferred=1024k |
| JVM Affinity: | start /affinity [F,F0,F00,F000] |
| JVM Instances: | 4 |
| JVM Initial Heap (MB): | 1650 |
| JVM Maximum Heap (MB): | 1650 |
| JVM Address Bits: | 64 |
| Boot Firmware Version: | I22 06/01/2009 |
| Management Firmware Version: | 1.77 03/30/2009 |
| Workload Version: | SSJ 1.2.6 |
| Director Location: | Controller |
| Other Software: | None |
| JVM Instance | ssj_ops@100% |
|---|---|
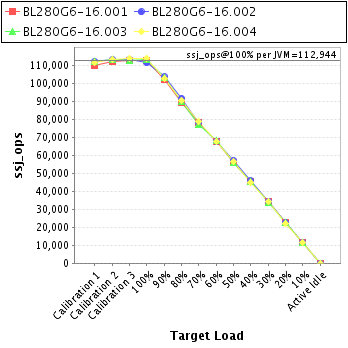
| BL280G6-16.001 | 112,752 |
| BL280G6-16.002 | 111,520 |
| BL280G6-16.003 | 113,421 |
| BL280G6-16.004 | 114,082 |
| ssj_ops@100% | 451,775 |
| ssj_ops@100% per JVM | 112,944 |
| Target Load | Actual Load | ssj_ops | |
|---|---|---|---|
| Target | Actual | ||
| Calibration 1 | 109,856 | ||
| Calibration 2 | 112,256 | ||
| Calibration 3 | 112,698 | ||
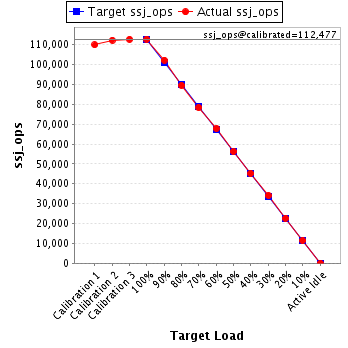
| ssj_ops@calibrated=112,477 | |||
| 100% | 100.2% | 112,477 | 112,752 |
| 90% | 90.9% | 101,230 | 102,202 |
| 80% | 79.6% | 89,982 | 89,483 |
| 70% | 69.7% | 78,734 | 78,346 |
| 60% | 60.3% | 67,486 | 67,828 |
| 50% | 50.0% | 56,239 | 56,291 |
| 40% | 40.2% | 44,991 | 45,208 |
| 30% | 30.3% | 33,743 | 34,135 |
| 20% | 20.2% | 22,495 | 22,729 |
| 10% | 10.2% | 11,248 | 11,498 |
| Active Idle | 0 | 0 | |
| Target Load | Actual Load | ssj_ops | |
|---|---|---|---|
| Target | Actual | ||
| Calibration 1 | 112,217 | ||
| Calibration 2 | 113,178 | ||
| Calibration 3 | 113,336 | ||
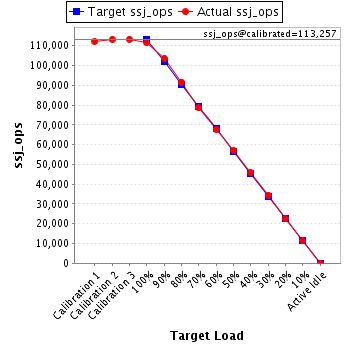
| ssj_ops@calibrated=113,257 | |||
| 100% | 98.5% | 113,257 | 111,520 |
| 90% | 91.5% | 101,931 | 103,624 |
| 80% | 80.9% | 90,606 | 91,648 |
| 70% | 69.4% | 79,280 | 78,574 |
| 60% | 59.8% | 67,954 | 67,717 |
| 50% | 50.4% | 56,629 | 57,066 |
| 40% | 40.4% | 45,303 | 45,786 |
| 30% | 30.4% | 33,977 | 34,398 |
| 20% | 19.8% | 22,651 | 22,433 |
| 10% | 10.0% | 11,326 | 11,315 |
| Active Idle | 0 | 0 | |
| Target Load | Actual Load | ssj_ops | |
|---|---|---|---|
| Target | Actual | ||
| Calibration 1 | 112,436 | ||
| Calibration 2 | 113,362 | ||
| Calibration 3 | 112,823 | ||
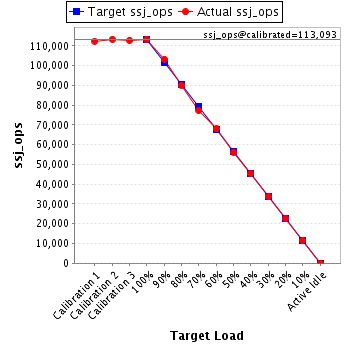
| ssj_ops@calibrated=113,093 | |||
| 100% | 100.3% | 113,093 | 113,421 |
| 90% | 91.3% | 101,783 | 103,246 |
| 80% | 79.6% | 90,474 | 90,003 |
| 70% | 68.4% | 79,165 | 77,393 |
| 60% | 60.2% | 67,856 | 68,044 |
| 50% | 49.7% | 56,546 | 56,196 |
| 40% | 40.1% | 45,237 | 45,332 |
| 30% | 30.0% | 33,928 | 33,915 |
| 20% | 19.9% | 22,619 | 22,503 |
| 10% | 10.2% | 11,309 | 11,555 |
| Active Idle | 0 | 0 | |
| Target Load | Actual Load | ssj_ops | |
|---|---|---|---|
| Target | Actual | ||
| Calibration 1 | 111,810 | ||
| Calibration 2 | 113,477 | ||
| Calibration 3 | 113,862 | ||
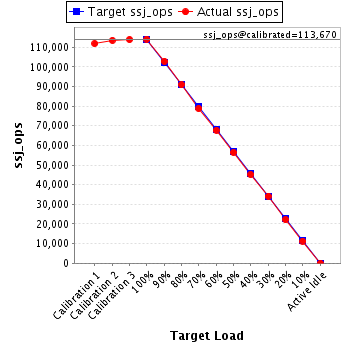
| ssj_ops@calibrated=113,670 | |||
| 100% | 100.4% | 113,670 | 114,082 |
| 90% | 90.5% | 102,303 | 102,848 |
| 80% | 79.9% | 90,936 | 90,814 |
| 70% | 69.3% | 79,569 | 78,764 |
| 60% | 59.6% | 68,202 | 67,720 |
| 50% | 49.6% | 56,835 | 56,436 |
| 40% | 39.7% | 45,468 | 45,095 |
| 30% | 30.1% | 34,101 | 34,208 |
| 20% | 19.5% | 22,734 | 22,166 |
| 10% | 10.0% | 11,367 | 11,316 |
| Active Idle | 0 | 0 | |