SPECpower_ssj2008
Host 'BL280G6-15' Performance Report
Copyright © 2007-2009 Standard Performance Evaluation Corporation
| Hewlett-Packard Company ProLiant BL280c G6 | ssj_ops@100% = 448,654 ssj_ops@100% per JVM = 112,163 |
||||
| Test Sponsor: | Hewlett-Packard Company | SPEC License #: | 3 | Test Method: | Multi Node |
| Tested By: | Hewlett-Packard Company | Test Location: | Houston, TX, USA | Test Date: | Jun 25, 2009 |
| Hardware Availability: | Aug-2009 | Software Availability: | Aug-2009 | Publication: | Jul 15, 2009 |
| System Source: | Single Supplier | System Designation: | Server | Power Provisioning: | Line-powered |
| Target Load | Actual Load | ssj_ops | |
|---|---|---|---|
| Target | Actual | ||
| Calibration 1 | 441,649 | ||
| Calibration 2 | 447,092 | ||
| Calibration 3 | 447,230 | ||
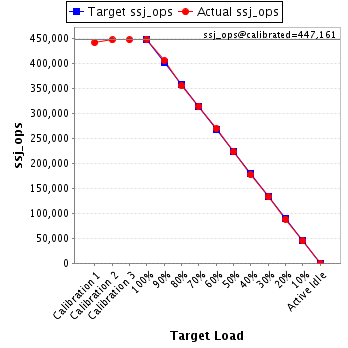
| ssj_ops@calibrated=447,161 | |||
| 100% | 100.3% | 447,161 | 448,654 |
| 90% | 90.7% | 402,445 | 405,592 |
| 80% | 79.4% | 357,729 | 355,030 |
| 70% | 70.2% | 313,013 | 313,921 |
| 60% | 60.2% | 268,297 | 269,403 |
| 50% | 49.9% | 223,581 | 223,027 |
| 40% | 39.6% | 178,864 | 177,234 |
| 30% | 29.8% | 134,148 | 133,099 |
| 20% | 19.8% | 89,432 | 88,426 |
| 10% | 10.0% | 44,716 | 44,646 |
| Active Idle | 0 | 0 | |
| Set Identifier: | sut |
| Set Description: | System Under Test |
| # of Identical Nodes: | 16 |
| Comment: | None |
| Hardware | |
|---|---|
| Hardware Vendor: | Hewlett-Packard Company |
| Model: | ProLiant BL280c G6 |
| Form Factor: | Blade |
| CPU Name: | Intel Xeon L5520 |
| CPU Characteristics: | 2.27GHz, 8 MB L3, 1333 MHz system bus |
| CPU Frequency (MHz): | 2267 |
| CPU(s) Enabled: | 8 cores, 2 chips, 4 cores/chip |
| Hardware Threads: | 16 (2 / core) |
| CPU(s) Orderable: | 1,2 chips |
| Primary Cache: | 32 KB I + 32 KB D on chip per core |
| Secondary Cache: | 256 KB I+D on chip per core |
| Tertiary Cache: | 8 MB I+D on chip per chip |
| Other Cache: | None |
| Memory Amount (GB): | 8.0 |
| # and size of DIMM: | 4 x 2048 MB |
| Memory Details: | PC3-10600E; Slots 2A and 4B populated on each CPU node |
| Power Supply Quantity and Rating (W): | None |
| Power Supply Details: | Shared |
| Disk Drive: | 1 x 32 GB SSD 2.5" SATA; HP part #461201-B21 |
| Disk Controller: | Integrated SATA controller |
| # and type of Network Interface Cards (NICs) Installed: | 2 x NC362i |
| NICs Enabled in Firmware / OS / Connected: | 2/2/1 |
| Network Speed (Mbit): | 1000 |
| Keyboard: | None |
| Mouse: | None |
| Monitor: | None |
| Optical Drives: | No |
| Other Hardware: | None |
| Software | |
|---|---|
| Power Management: | Enabled (see SUT Notes) |
| Operating System (OS): | Microsoft Windows Server 2008 x64 Enterprise Edition |
| OS Version: | Service Pack 2 |
| Filesystem: | NTFS |
| JVM Vendor: | Oracle Corporation |
| JVM Version: | Oracle JRockit(R) (build P28.0.0-29-114096-1.6.0_11-20090427-1759-windows-x86_64, compiled mode) |
| JVM Command-line Options: | -Xms1650m -Xmx1650m -Xns1500m -XXaggressive -XlargePages -XXthroughputCompaction -XXcallprofiling -XXlazyUnlocking -Xgc:genpar -XXgcthreads:4 -XXtlasize:min=12k,preferred=1024k |
| JVM Affinity: | start /affinity [F,F0,F00,F000] |
| JVM Instances: | 4 |
| JVM Initial Heap (MB): | 1650 |
| JVM Maximum Heap (MB): | 1650 |
| JVM Address Bits: | 64 |
| Boot Firmware Version: | I22 06/01/2009 |
| Management Firmware Version: | 1.77 03/30/2009 |
| Workload Version: | SSJ 1.2.6 |
| Director Location: | Controller |
| Other Software: | None |
| JVM Instance | ssj_ops@100% |
|---|---|
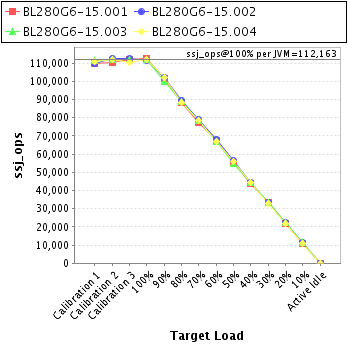
| BL280G6-15.001 | 112,760 |
| BL280G6-15.002 | 111,632 |
| BL280G6-15.003 | 112,304 |
| BL280G6-15.004 | 111,957 |
| ssj_ops@100% | 448,654 |
| ssj_ops@100% per JVM | 112,163 |
| Target Load | Actual Load | ssj_ops | |
|---|---|---|---|
| Target | Actual | ||
| Calibration 1 | 109,933 | ||
| Calibration 2 | 110,613 | ||
| Calibration 3 | 111,908 | ||
| ssj_ops@calibrated=111,260 | |||
| 100% | 101.3% | 111,260 | 112,760 |
| 90% | 91.1% | 100,134 | 101,394 |
| 80% | 79.3% | 89,008 | 88,179 |
| 70% | 69.7% | 77,882 | 77,584 |
| 60% | 60.6% | 66,756 | 67,410 |
| 50% | 49.9% | 55,630 | 55,515 |
| 40% | 39.4% | 44,504 | 43,837 |
| 30% | 29.9% | 33,378 | 33,258 |
| 20% | 19.6% | 22,252 | 21,858 |
| 10% | 10.0% | 11,126 | 11,101 |
| Active Idle | 0 | 0 | |

| Target Load | Actual Load | ssj_ops | |
|---|---|---|---|
| Target | Actual | ||
| Calibration 1 | 109,793 | ||
| Calibration 2 | 112,623 | ||
| Calibration 3 | 112,565 | ||
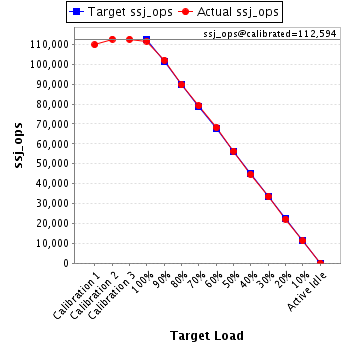
| ssj_ops@calibrated=112,594 | |||
| 100% | 99.1% | 112,594 | 111,632 |
| 90% | 90.7% | 101,335 | 102,117 |
| 80% | 79.6% | 90,075 | 89,609 |
| 70% | 70.2% | 78,816 | 79,071 |
| 60% | 60.6% | 67,556 | 68,199 |
| 50% | 50.1% | 56,297 | 56,413 |
| 40% | 39.6% | 45,038 | 44,633 |
| 30% | 29.7% | 33,778 | 33,483 |
| 20% | 19.7% | 22,519 | 22,220 |
| 10% | 10.0% | 11,259 | 11,241 |
| Active Idle | 0 | 0 | |
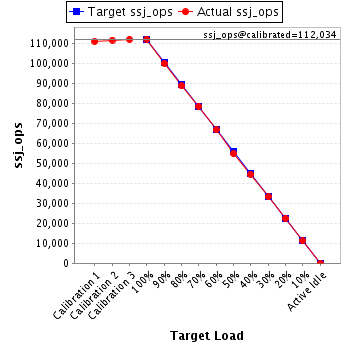
| Target Load | Actual Load | ssj_ops | |
|---|---|---|---|
| Target | Actual | ||
| Calibration 1 | 111,259 | ||
| Calibration 2 | 111,858 | ||
| Calibration 3 | 112,210 | ||
| ssj_ops@calibrated=112,034 | |||
| 100% | 100.2% | 112,034 | 112,304 |
| 90% | 89.4% | 100,831 | 100,168 |
| 80% | 79.3% | 89,627 | 88,859 |
| 70% | 70.2% | 78,424 | 78,634 |
| 60% | 59.7% | 67,220 | 66,842 |
| 50% | 49.0% | 56,017 | 54,936 |
| 40% | 39.8% | 44,814 | 44,600 |
| 30% | 29.7% | 33,610 | 33,312 |
| 20% | 20.1% | 22,407 | 22,468 |
| 10% | 10.0% | 11,203 | 11,170 |
| Active Idle | 0 | 0 | |
| Target Load | Actual Load | ssj_ops | |
|---|---|---|---|
| Target | Actual | ||
| Calibration 1 | 110,664 | ||
| Calibration 2 | 111,998 | ||
| Calibration 3 | 110,547 | ||
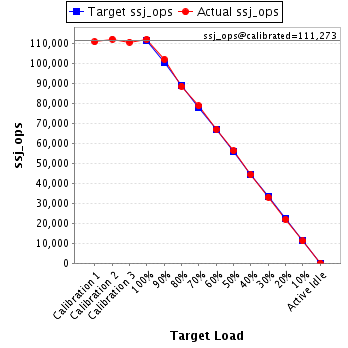
| ssj_ops@calibrated=111,273 | |||
| 100% | 100.6% | 111,273 | 111,957 |
| 90% | 91.6% | 100,146 | 101,913 |
| 80% | 79.4% | 89,018 | 88,382 |
| 70% | 70.7% | 77,891 | 78,631 |
| 60% | 60.2% | 66,764 | 66,953 |
| 50% | 50.5% | 55,636 | 56,163 |
| 40% | 39.7% | 44,509 | 44,164 |
| 30% | 29.7% | 33,382 | 33,047 |
| 20% | 19.7% | 22,255 | 21,880 |
| 10% | 10.0% | 11,127 | 11,133 |
| Active Idle | 0 | 0 | |