
SPECpower_ssj2008
Host 'BL280G6-12' Performance Report
Copyright © 2007-2009 Standard Performance Evaluation Corporation
| Hewlett-Packard Company ProLiant BL280c G6 | ssj_ops@100% = 450,271 ssj_ops@100% per JVM = 112,568 |
||||
| Test Sponsor: | Hewlett-Packard Company | SPEC License #: | 3 | Test Method: | Multi Node |
| Tested By: | Hewlett-Packard Company | Test Location: | Houston, TX, USA | Test Date: | Jun 25, 2009 |
| Hardware Availability: | Aug-2009 | Software Availability: | Aug-2009 | Publication: | Jul 15, 2009 |
| System Source: | Single Supplier | System Designation: | Server | Power Provisioning: | Line-powered |
| Target Load | Actual Load | ssj_ops | |
|---|---|---|---|
| Target | Actual | ||
| Calibration 1 | 447,646 | ||
| Calibration 2 | 451,497 | ||
| Calibration 3 | 451,997 | ||
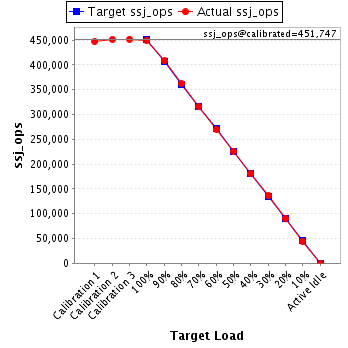
| ssj_ops@calibrated=451,747 | |||
| 100% | 99.7% | 451,747 | 450,271 |
| 90% | 90.3% | 406,573 | 408,008 |
| 80% | 80.2% | 361,398 | 362,464 |
| 70% | 70.0% | 316,223 | 316,044 |
| 60% | 59.8% | 271,048 | 270,256 |
| 50% | 50.1% | 225,874 | 226,138 |
| 40% | 40.0% | 180,699 | 180,734 |
| 30% | 30.1% | 135,524 | 136,029 |
| 20% | 20.0% | 90,349 | 90,284 |
| 10% | 9.9% | 45,175 | 44,688 |
| Active Idle | 0 | 0 | |
| Set Identifier: | sut |
| Set Description: | System Under Test |
| # of Identical Nodes: | 16 |
| Comment: | None |
| Hardware | |
|---|---|
| Hardware Vendor: | Hewlett-Packard Company |
| Model: | ProLiant BL280c G6 |
| Form Factor: | Blade |
| CPU Name: | Intel Xeon L5520 |
| CPU Characteristics: | 2.27GHz, 8 MB L3, 1333 MHz system bus |
| CPU Frequency (MHz): | 2267 |
| CPU(s) Enabled: | 8 cores, 2 chips, 4 cores/chip |
| Hardware Threads: | 16 (2 / core) |
| CPU(s) Orderable: | 1,2 chips |
| Primary Cache: | 32 KB I + 32 KB D on chip per core |
| Secondary Cache: | 256 KB I+D on chip per core |
| Tertiary Cache: | 8 MB I+D on chip per chip |
| Other Cache: | None |
| Memory Amount (GB): | 8.0 |
| # and size of DIMM: | 4 x 2048 MB |
| Memory Details: | PC3-10600E; Slots 2A and 4B populated on each CPU node |
| Power Supply Quantity and Rating (W): | None |
| Power Supply Details: | Shared |
| Disk Drive: | 1 x 32 GB SSD 2.5" SATA; HP part #461201-B21 |
| Disk Controller: | Integrated SATA controller |
| # and type of Network Interface Cards (NICs) Installed: | 2 x NC362i |
| NICs Enabled in Firmware / OS / Connected: | 2/2/1 |
| Network Speed (Mbit): | 1000 |
| Keyboard: | None |
| Mouse: | None |
| Monitor: | None |
| Optical Drives: | No |
| Other Hardware: | None |
| Software | |
|---|---|
| Power Management: | Enabled (see SUT Notes) |
| Operating System (OS): | Microsoft Windows Server 2008 x64 Enterprise Edition |
| OS Version: | Service Pack 2 |
| Filesystem: | NTFS |
| JVM Vendor: | Oracle Corporation |
| JVM Version: | Oracle JRockit(R) (build P28.0.0-29-114096-1.6.0_11-20090427-1759-windows-x86_64, compiled mode) |
| JVM Command-line Options: | -Xms1650m -Xmx1650m -Xns1500m -XXaggressive -XlargePages -XXthroughputCompaction -XXcallprofiling -XXlazyUnlocking -Xgc:genpar -XXgcthreads:4 -XXtlasize:min=12k,preferred=1024k |
| JVM Affinity: | start /affinity [F,F0,F00,F000] |
| JVM Instances: | 4 |
| JVM Initial Heap (MB): | 1650 |
| JVM Maximum Heap (MB): | 1650 |
| JVM Address Bits: | 64 |
| Boot Firmware Version: | I22 06/01/2009 |
| Management Firmware Version: | 1.77 03/30/2009 |
| Workload Version: | SSJ 1.2.6 |
| Director Location: | Controller |
| Other Software: | None |
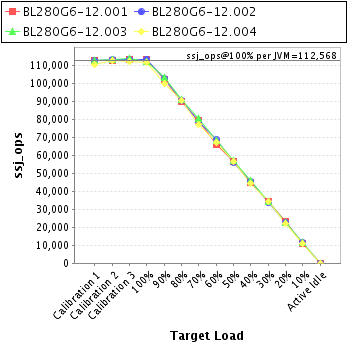
| JVM Instance | ssj_ops@100% |
|---|---|
| BL280G6-12.001 | 113,184 |
| BL280G6-12.002 | 113,250 |
| BL280G6-12.003 | 112,059 |
| BL280G6-12.004 | 111,779 |
| ssj_ops@100% | 450,271 |
| ssj_ops@100% per JVM | 112,568 |
| Target Load | Actual Load | ssj_ops | |
|---|---|---|---|
| Target | Actual | ||
| Calibration 1 | 112,516 | ||
| Calibration 2 | 112,734 | ||
| Calibration 3 | 112,897 | ||
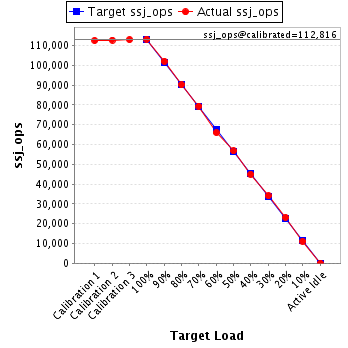
| ssj_ops@calibrated=112,816 | |||
| 100% | 100.3% | 112,816 | 113,184 |
| 90% | 90.5% | 101,534 | 102,059 |
| 80% | 79.9% | 90,253 | 90,087 |
| 70% | 70.4% | 78,971 | 79,389 |
| 60% | 58.5% | 67,689 | 65,962 |
| 50% | 50.3% | 56,408 | 56,711 |
| 40% | 39.8% | 45,126 | 44,928 |
| 30% | 30.2% | 33,845 | 34,039 |
| 20% | 20.5% | 22,563 | 23,151 |
| 10% | 9.9% | 11,282 | 11,116 |
| Active Idle | 0 | 0 | |
| Target Load | Actual Load | ssj_ops | |
|---|---|---|---|
| Target | Actual | ||
| Calibration 1 | 112,409 | ||
| Calibration 2 | 112,964 | ||
| Calibration 3 | 113,051 | ||
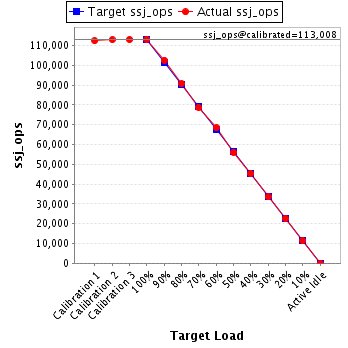
| ssj_ops@calibrated=113,008 | |||
| 100% | 100.2% | 113,008 | 113,250 |
| 90% | 90.8% | 101,707 | 102,593 |
| 80% | 80.2% | 90,406 | 90,629 |
| 70% | 69.7% | 79,105 | 78,716 |
| 60% | 60.6% | 67,805 | 68,502 |
| 50% | 49.7% | 56,504 | 56,143 |
| 40% | 40.1% | 45,203 | 45,370 |
| 30% | 29.7% | 33,902 | 33,517 |
| 20% | 19.9% | 22,602 | 22,479 |
| 10% | 10.0% | 11,301 | 11,316 |
| Active Idle | 0 | 0 | |
| Target Load | Actual Load | ssj_ops | |
|---|---|---|---|
| Target | Actual | ||
| Calibration 1 | 112,513 | ||
| Calibration 2 | 113,374 | ||
| Calibration 3 | 113,903 | ||
| ssj_ops@calibrated=113,639 | |||
| 100% | 98.6% | 113,639 | 112,059 |
| 90% | 91.0% | 102,275 | 103,436 |
| 80% | 80.2% | 90,911 | 91,114 |
| 70% | 70.9% | 79,547 | 80,606 |
| 60% | 60.2% | 68,183 | 68,443 |
| 50% | 50.0% | 56,819 | 56,856 |
| 40% | 40.5% | 45,456 | 46,059 |
| 30% | 30.2% | 34,092 | 34,375 |
| 20% | 19.9% | 22,728 | 22,629 |
| 10% | 10.0% | 11,364 | 11,341 |
| Active Idle | 0 | 0 | |

| Target Load | Actual Load | ssj_ops | |
|---|---|---|---|
| Target | Actual | ||
| Calibration 1 | 110,207 | ||
| Calibration 2 | 112,424 | ||
| Calibration 3 | 112,146 | ||
| ssj_ops@calibrated=112,285 | |||
| 100% | 99.5% | 112,285 | 111,779 |
| 90% | 89.0% | 101,057 | 99,919 |
| 80% | 80.7% | 89,828 | 90,633 |
| 70% | 68.9% | 78,600 | 77,333 |
| 60% | 60.0% | 67,371 | 67,349 |
| 50% | 50.3% | 56,143 | 56,427 |
| 40% | 39.5% | 44,914 | 44,377 |
| 30% | 30.4% | 33,686 | 34,097 |
| 20% | 19.6% | 22,457 | 22,025 |
| 10% | 9.7% | 11,229 | 10,915 |
| Active Idle | 0 | 0 | |
