
SPECpower_ssj2008
Host 'BL280G6-10' Performance Report
Copyright © 2007-2009 Standard Performance Evaluation Corporation
| Hewlett-Packard Company ProLiant BL280c G6 | ssj_ops@100% = 450,324 ssj_ops@100% per JVM = 112,581 |
||||
| Test Sponsor: | Hewlett-Packard Company | SPEC License #: | 3 | Test Method: | Multi Node |
| Tested By: | Hewlett-Packard Company | Test Location: | Houston, TX, USA | Test Date: | Jun 25, 2009 |
| Hardware Availability: | Aug-2009 | Software Availability: | Aug-2009 | Publication: | Jul 15, 2009 |
| System Source: | Single Supplier | System Designation: | Server | Power Provisioning: | Line-powered |
| Target Load | Actual Load | ssj_ops | |
|---|---|---|---|
| Target | Actual | ||
| Calibration 1 | 443,858 | ||
| Calibration 2 | 449,127 | ||
| Calibration 3 | 450,263 | ||
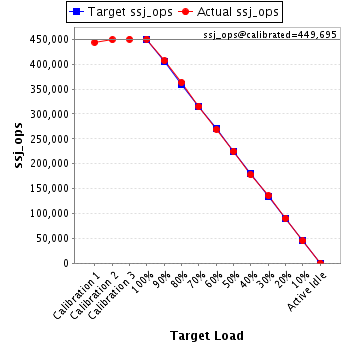
| ssj_ops@calibrated=449,695 | |||
| 100% | 100.1% | 449,695 | 450,324 |
| 90% | 90.5% | 404,725 | 406,976 |
| 80% | 80.8% | 359,756 | 363,180 |
| 70% | 70.0% | 314,786 | 314,922 |
| 60% | 59.8% | 269,817 | 269,096 |
| 50% | 50.1% | 224,847 | 225,086 |
| 40% | 39.5% | 179,878 | 177,689 |
| 30% | 30.2% | 134,908 | 135,704 |
| 20% | 20.1% | 89,939 | 90,376 |
| 10% | 10.0% | 44,969 | 44,969 |
| Active Idle | 0 | 0 | |
| Set Identifier: | sut |
| Set Description: | System Under Test |
| # of Identical Nodes: | 16 |
| Comment: | None |
| Hardware | |
|---|---|
| Hardware Vendor: | Hewlett-Packard Company |
| Model: | ProLiant BL280c G6 |
| Form Factor: | Blade |
| CPU Name: | Intel Xeon L5520 |
| CPU Characteristics: | 2.27GHz, 8 MB L3, 1333 MHz system bus |
| CPU Frequency (MHz): | 2267 |
| CPU(s) Enabled: | 8 cores, 2 chips, 4 cores/chip |
| Hardware Threads: | 16 (2 / core) |
| CPU(s) Orderable: | 1,2 chips |
| Primary Cache: | 32 KB I + 32 KB D on chip per core |
| Secondary Cache: | 256 KB I+D on chip per core |
| Tertiary Cache: | 8 MB I+D on chip per chip |
| Other Cache: | None |
| Memory Amount (GB): | 8.0 |
| # and size of DIMM: | 4 x 2048 MB |
| Memory Details: | PC3-10600E; Slots 2A and 4B populated on each CPU node |
| Power Supply Quantity and Rating (W): | None |
| Power Supply Details: | Shared |
| Disk Drive: | 1 x 32 GB SSD 2.5" SATA; HP part #461201-B21 |
| Disk Controller: | Integrated SATA controller |
| # and type of Network Interface Cards (NICs) Installed: | 2 x NC362i |
| NICs Enabled in Firmware / OS / Connected: | 2/2/1 |
| Network Speed (Mbit): | 1000 |
| Keyboard: | None |
| Mouse: | None |
| Monitor: | None |
| Optical Drives: | No |
| Other Hardware: | None |
| Software | |
|---|---|
| Power Management: | Enabled (see SUT Notes) |
| Operating System (OS): | Microsoft Windows Server 2008 x64 Enterprise Edition |
| OS Version: | Service Pack 2 |
| Filesystem: | NTFS |
| JVM Vendor: | Oracle Corporation |
| JVM Version: | Oracle JRockit(R) (build P28.0.0-29-114096-1.6.0_11-20090427-1759-windows-x86_64, compiled mode) |
| JVM Command-line Options: | -Xms1650m -Xmx1650m -Xns1500m -XXaggressive -XlargePages -XXthroughputCompaction -XXcallprofiling -XXlazyUnlocking -Xgc:genpar -XXgcthreads:4 -XXtlasize:min=12k,preferred=1024k |
| JVM Affinity: | start /affinity [F,F0,F00,F000] |
| JVM Instances: | 4 |
| JVM Initial Heap (MB): | 1650 |
| JVM Maximum Heap (MB): | 1650 |
| JVM Address Bits: | 64 |
| Boot Firmware Version: | I22 06/01/2009 |
| Management Firmware Version: | 1.77 03/30/2009 |
| Workload Version: | SSJ 1.2.6 |
| Director Location: | Controller |
| Other Software: | None |
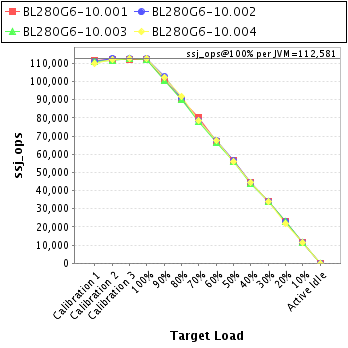
| JVM Instance | ssj_ops@100% |
|---|---|
| BL280G6-10.001 | 112,288 |
| BL280G6-10.002 | 112,880 |
| BL280G6-10.003 | 112,255 |
| BL280G6-10.004 | 112,901 |
| ssj_ops@100% | 450,324 |
| ssj_ops@100% per JVM | 112,581 |
| Target Load | Actual Load | ssj_ops | |
|---|---|---|---|
| Target | Actual | ||
| Calibration 1 | 111,587 | ||
| Calibration 2 | 112,446 | ||
| Calibration 3 | 111,971 | ||
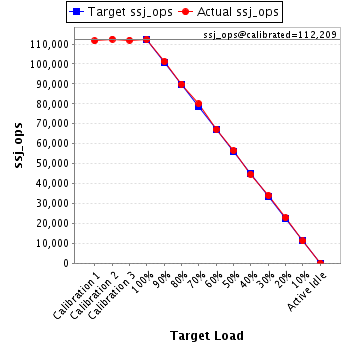
| ssj_ops@calibrated=112,209 | |||
| 100% | 100.1% | 112,209 | 112,288 |
| 90% | 90.2% | 100,988 | 101,244 |
| 80% | 80.1% | 89,767 | 89,916 |
| 70% | 71.3% | 78,546 | 79,976 |
| 60% | 59.9% | 67,325 | 67,228 |
| 50% | 50.4% | 56,104 | 56,547 |
| 40% | 39.8% | 44,883 | 44,625 |
| 30% | 30.3% | 33,663 | 34,004 |
| 20% | 20.4% | 22,442 | 22,841 |
| 10% | 10.0% | 11,221 | 11,196 |
| Active Idle | 0 | 0 | |
| Target Load | Actual Load | ssj_ops | |
|---|---|---|---|
| Target | Actual | ||
| Calibration 1 | 110,844 | ||
| Calibration 2 | 112,765 | ||
| Calibration 3 | 112,566 | ||
| ssj_ops@calibrated=112,666 | |||
| 100% | 100.2% | 112,666 | 112,880 |
| 90% | 91.0% | 101,399 | 102,580 |
| 80% | 80.7% | 90,132 | 90,941 |
| 70% | 69.5% | 78,866 | 78,328 |
| 60% | 60.0% | 67,599 | 67,622 |
| 50% | 50.0% | 56,333 | 56,325 |
| 40% | 39.3% | 45,066 | 44,261 |
| 30% | 30.3% | 33,800 | 34,084 |
| 20% | 20.2% | 22,533 | 22,716 |
| 10% | 10.0% | 11,267 | 11,229 |
| Active Idle | 0 | 0 | |

| Target Load | Actual Load | ssj_ops | |
|---|---|---|---|
| Target | Actual | ||
| Calibration 1 | 111,342 | ||
| Calibration 2 | 111,739 | ||
| Calibration 3 | 112,839 | ||
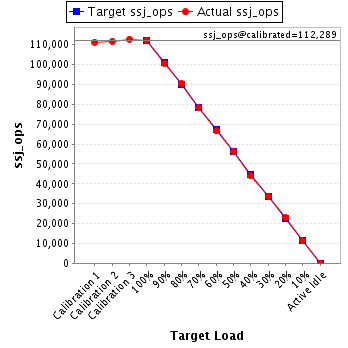
| ssj_ops@calibrated=112,289 | |||
| 100% | 100.0% | 112,289 | 112,255 |
| 90% | 89.7% | 101,060 | 100,771 |
| 80% | 80.5% | 89,831 | 90,404 |
| 70% | 69.7% | 78,602 | 78,243 |
| 60% | 59.3% | 67,373 | 66,603 |
| 50% | 50.0% | 56,144 | 56,162 |
| 40% | 39.3% | 44,916 | 44,079 |
| 30% | 30.1% | 33,687 | 33,759 |
| 20% | 20.3% | 22,458 | 22,819 |
| 10% | 10.1% | 11,229 | 11,349 |
| Active Idle | 0 | 0 | |
| Target Load | Actual Load | ssj_ops | |
|---|---|---|---|
| Target | Actual | ||
| Calibration 1 | 110,086 | ||
| Calibration 2 | 112,176 | ||
| Calibration 3 | 112,887 | ||
| ssj_ops@calibrated=112,532 | |||
| 100% | 100.3% | 112,532 | 112,901 |
| 90% | 91.0% | 101,279 | 102,381 |
| 80% | 81.7% | 90,025 | 91,919 |
| 70% | 69.6% | 78,772 | 78,374 |
| 60% | 60.1% | 67,519 | 67,642 |
| 50% | 49.8% | 56,266 | 56,052 |
| 40% | 39.7% | 45,013 | 44,723 |
| 30% | 30.1% | 33,760 | 33,856 |
| 20% | 19.5% | 22,506 | 21,999 |
| 10% | 9.9% | 11,253 | 11,195 |
| Active Idle | 0 | 0 | |
