SPECpower_ssj2008
Host 'BL280G6-08' Performance Report
Copyright © 2007-2009 Standard Performance Evaluation Corporation
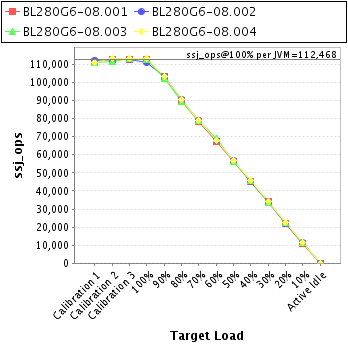
| Hewlett-Packard Company ProLiant BL280c G6 | ssj_ops@100% = 449,872 ssj_ops@100% per JVM = 112,468 |
||||
| Test Sponsor: | Hewlett-Packard Company | SPEC License #: | 3 | Test Method: | Multi Node |
| Tested By: | Hewlett-Packard Company | Test Location: | Houston, TX, USA | Test Date: | Jun 25, 2009 |
| Hardware Availability: | Aug-2009 | Software Availability: | Aug-2009 | Publication: | Jul 15, 2009 |
| System Source: | Single Supplier | System Designation: | Server | Power Provisioning: | Line-powered |
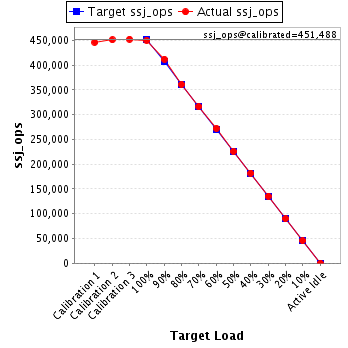
| Target Load | Actual Load | ssj_ops | |
|---|---|---|---|
| Target | Actual | ||
| Calibration 1 | 445,911 | ||
| Calibration 2 | 450,743 | ||
| Calibration 3 | 452,233 | ||
| ssj_ops@calibrated=451,488 | |||
| 100% | 99.6% | 451,488 | 449,872 |
| 90% | 91.2% | 406,339 | 411,953 |
| 80% | 79.9% | 361,190 | 360,904 |
| 70% | 70.0% | 316,042 | 316,035 |
| 60% | 60.3% | 270,893 | 272,221 |
| 50% | 50.1% | 225,744 | 226,073 |
| 40% | 40.3% | 180,595 | 182,094 |
| 30% | 30.0% | 135,446 | 135,434 |
| 20% | 19.9% | 90,298 | 89,705 |
| 10% | 10.1% | 45,149 | 45,585 |
| Active Idle | 0 | 0 | |
| Set Identifier: | sut |
| Set Description: | System Under Test |
| # of Identical Nodes: | 16 |
| Comment: | None |
| Hardware | |
|---|---|
| Hardware Vendor: | Hewlett-Packard Company |
| Model: | ProLiant BL280c G6 |
| Form Factor: | Blade |
| CPU Name: | Intel Xeon L5520 |
| CPU Characteristics: | 2.27GHz, 8 MB L3, 1333 MHz system bus |
| CPU Frequency (MHz): | 2267 |
| CPU(s) Enabled: | 8 cores, 2 chips, 4 cores/chip |
| Hardware Threads: | 16 (2 / core) |
| CPU(s) Orderable: | 1,2 chips |
| Primary Cache: | 32 KB I + 32 KB D on chip per core |
| Secondary Cache: | 256 KB I+D on chip per core |
| Tertiary Cache: | 8 MB I+D on chip per chip |
| Other Cache: | None |
| Memory Amount (GB): | 8.0 |
| # and size of DIMM: | 4 x 2048 MB |
| Memory Details: | PC3-10600E; Slots 2A and 4B populated on each CPU node |
| Power Supply Quantity and Rating (W): | None |
| Power Supply Details: | Shared |
| Disk Drive: | 1 x 32 GB SSD 2.5" SATA; HP part #461201-B21 |
| Disk Controller: | Integrated SATA controller |
| # and type of Network Interface Cards (NICs) Installed: | 2 x NC362i |
| NICs Enabled in Firmware / OS / Connected: | 2/2/1 |
| Network Speed (Mbit): | 1000 |
| Keyboard: | None |
| Mouse: | None |
| Monitor: | None |
| Optical Drives: | No |
| Other Hardware: | None |
| Software | |
|---|---|
| Power Management: | Enabled (see SUT Notes) |
| Operating System (OS): | Microsoft Windows Server 2008 x64 Enterprise Edition |
| OS Version: | Service Pack 2 |
| Filesystem: | NTFS |
| JVM Vendor: | Oracle Corporation |
| JVM Version: | Oracle JRockit(R) (build P28.0.0-29-114096-1.6.0_11-20090427-1759-windows-x86_64, compiled mode) |
| JVM Command-line Options: | -Xms1650m -Xmx1650m -Xns1500m -XXaggressive -XlargePages -XXthroughputCompaction -XXcallprofiling -XXlazyUnlocking -Xgc:genpar -XXgcthreads:4 -XXtlasize:min=12k,preferred=1024k |
| JVM Affinity: | start /affinity [F,F0,F00,F000] |
| JVM Instances: | 4 |
| JVM Initial Heap (MB): | 1650 |
| JVM Maximum Heap (MB): | 1650 |
| JVM Address Bits: | 64 |
| Boot Firmware Version: | I22 06/01/2009 |
| Management Firmware Version: | 1.77 03/30/2009 |
| Workload Version: | SSJ 1.2.6 |
| Director Location: | Controller |
| Other Software: | None |
| JVM Instance | ssj_ops@100% |
|---|---|
| BL280G6-08.001 | 112,659 |
| BL280G6-08.002 | 110,977 |
| BL280G6-08.003 | 112,951 |
| BL280G6-08.004 | 113,285 |
| ssj_ops@100% | 449,872 |
| ssj_ops@100% per JVM | 112,468 |
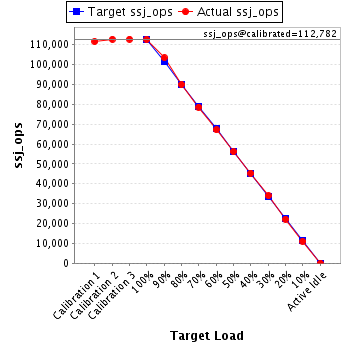
| Target Load | Actual Load | ssj_ops | |
|---|---|---|---|
| Target | Actual | ||
| Calibration 1 | 111,633 | ||
| Calibration 2 | 112,768 | ||
| Calibration 3 | 112,795 | ||
| ssj_ops@calibrated=112,782 | |||
| 100% | 99.9% | 112,782 | 112,659 |
| 90% | 91.7% | 101,503 | 103,425 |
| 80% | 79.7% | 90,225 | 89,885 |
| 70% | 69.7% | 78,947 | 78,651 |
| 60% | 59.6% | 67,669 | 67,191 |
| 50% | 49.8% | 56,391 | 56,212 |
| 40% | 40.2% | 45,113 | 45,355 |
| 30% | 30.1% | 33,834 | 33,986 |
| 20% | 19.7% | 22,556 | 22,221 |
| 10% | 9.8% | 11,278 | 11,066 |
| Active Idle | 0 | 0 | |
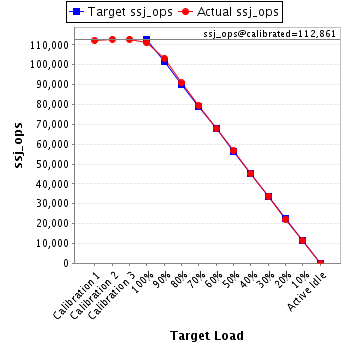
| Target Load | Actual Load | ssj_ops | |
|---|---|---|---|
| Target | Actual | ||
| Calibration 1 | 112,232 | ||
| Calibration 2 | 112,838 | ||
| Calibration 3 | 112,884 | ||
| ssj_ops@calibrated=112,861 | |||
| 100% | 98.3% | 112,861 | 110,977 |
| 90% | 91.4% | 101,575 | 103,208 |
| 80% | 80.5% | 90,289 | 90,819 |
| 70% | 70.2% | 79,002 | 79,222 |
| 60% | 60.1% | 67,716 | 67,811 |
| 50% | 50.2% | 56,430 | 56,640 |
| 40% | 40.0% | 45,144 | 45,146 |
| 30% | 30.0% | 33,858 | 33,876 |
| 20% | 19.6% | 22,572 | 22,089 |
| 10% | 10.1% | 11,286 | 11,439 |
| Active Idle | 0 | 0 | |
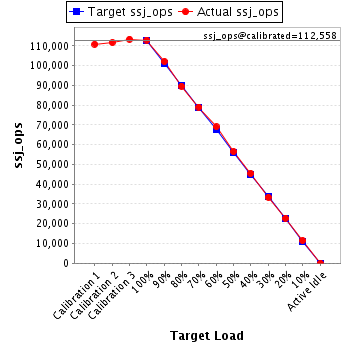
| Target Load | Actual Load | ssj_ops | |
|---|---|---|---|
| Target | Actual | ||
| Calibration 1 | 110,890 | ||
| Calibration 2 | 111,721 | ||
| Calibration 3 | 113,395 | ||
| ssj_ops@calibrated=112,558 | |||
| 100% | 100.3% | 112,558 | 112,951 |
| 90% | 90.7% | 101,302 | 102,097 |
| 80% | 79.7% | 90,046 | 89,661 |
| 70% | 70.2% | 78,791 | 79,060 |
| 60% | 61.4% | 67,535 | 69,101 |
| 50% | 50.2% | 56,279 | 56,523 |
| 40% | 40.5% | 45,023 | 45,571 |
| 30% | 29.7% | 33,767 | 33,398 |
| 20% | 20.3% | 22,512 | 22,815 |
| 10% | 10.3% | 11,256 | 11,540 |
| Active Idle | 0 | 0 | |
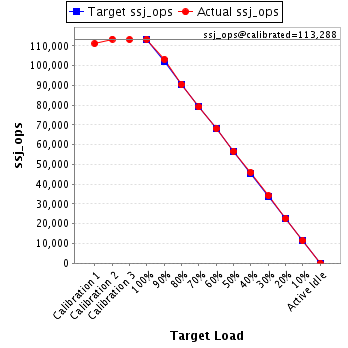
| Target Load | Actual Load | ssj_ops | |
|---|---|---|---|
| Target | Actual | ||
| Calibration 1 | 111,156 | ||
| Calibration 2 | 113,417 | ||
| Calibration 3 | 113,159 | ||
| ssj_ops@calibrated=113,288 | |||
| 100% | 100.0% | 113,288 | 113,285 |
| 90% | 91.1% | 101,959 | 103,224 |
| 80% | 79.9% | 90,630 | 90,538 |
| 70% | 69.8% | 79,301 | 79,103 |
| 60% | 60.1% | 67,973 | 68,118 |
| 50% | 50.0% | 56,644 | 56,698 |
| 40% | 40.6% | 45,315 | 46,023 |
| 30% | 30.2% | 33,986 | 34,174 |
| 20% | 19.9% | 22,658 | 22,579 |
| 10% | 10.2% | 11,329 | 11,540 |
| Active Idle | 0 | 0 | |