SPECpower_ssj2008
Host 'BL280G6-06' Performance Report
Copyright © 2007-2009 Standard Performance Evaluation Corporation
| Hewlett-Packard Company ProLiant BL280c G6 | ssj_ops@100% = 451,012 ssj_ops@100% per JVM = 112,753 |
||||
| Test Sponsor: | Hewlett-Packard Company | SPEC License #: | 3 | Test Method: | Multi Node |
| Tested By: | Hewlett-Packard Company | Test Location: | Houston, TX, USA | Test Date: | Jun 25, 2009 |
| Hardware Availability: | Aug-2009 | Software Availability: | Aug-2009 | Publication: | Jul 15, 2009 |
| System Source: | Single Supplier | System Designation: | Server | Power Provisioning: | Line-powered |
| Target Load | Actual Load | ssj_ops | |
|---|---|---|---|
| Target | Actual | ||
| Calibration 1 | 443,083 | ||
| Calibration 2 | 451,331 | ||
| Calibration 3 | 452,134 | ||
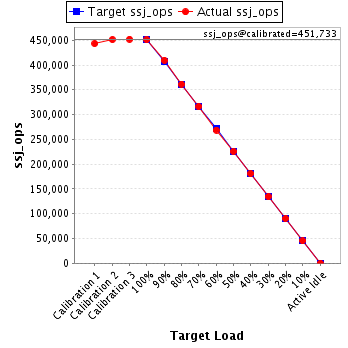
| ssj_ops@calibrated=451,733 | |||
| 100% | 99.8% | 451,733 | 451,012 |
| 90% | 90.7% | 406,559 | 409,597 |
| 80% | 80.0% | 361,386 | 361,602 |
| 70% | 70.0% | 316,213 | 316,269 |
| 60% | 59.5% | 271,040 | 268,770 |
| 50% | 50.0% | 225,866 | 226,025 |
| 40% | 40.0% | 180,693 | 180,774 |
| 30% | 29.8% | 135,520 | 134,453 |
| 20% | 20.0% | 90,347 | 90,290 |
| 10% | 10.0% | 45,173 | 45,256 |
| Active Idle | 0 | 0 | |
| Set Identifier: | sut |
| Set Description: | System Under Test |
| # of Identical Nodes: | 16 |
| Comment: | None |
| Hardware | |
|---|---|
| Hardware Vendor: | Hewlett-Packard Company |
| Model: | ProLiant BL280c G6 |
| Form Factor: | Blade |
| CPU Name: | Intel Xeon L5520 |
| CPU Characteristics: | 2.27GHz, 8 MB L3, 1333 MHz system bus |
| CPU Frequency (MHz): | 2267 |
| CPU(s) Enabled: | 8 cores, 2 chips, 4 cores/chip |
| Hardware Threads: | 16 (2 / core) |
| CPU(s) Orderable: | 1,2 chips |
| Primary Cache: | 32 KB I + 32 KB D on chip per core |
| Secondary Cache: | 256 KB I+D on chip per core |
| Tertiary Cache: | 8 MB I+D on chip per chip |
| Other Cache: | None |
| Memory Amount (GB): | 8.0 |
| # and size of DIMM: | 4 x 2048 MB |
| Memory Details: | PC3-10600E; Slots 2A and 4B populated on each CPU node |
| Power Supply Quantity and Rating (W): | None |
| Power Supply Details: | Shared |
| Disk Drive: | 1 x 32 GB SSD 2.5" SATA; HP part #461201-B21 |
| Disk Controller: | Integrated SATA controller |
| # and type of Network Interface Cards (NICs) Installed: | 2 x NC362i |
| NICs Enabled in Firmware / OS / Connected: | 2/2/1 |
| Network Speed (Mbit): | 1000 |
| Keyboard: | None |
| Mouse: | None |
| Monitor: | None |
| Optical Drives: | No |
| Other Hardware: | None |
| Software | |
|---|---|
| Power Management: | Enabled (see SUT Notes) |
| Operating System (OS): | Microsoft Windows Server 2008 x64 Enterprise Edition |
| OS Version: | Service Pack 2 |
| Filesystem: | NTFS |
| JVM Vendor: | Oracle Corporation |
| JVM Version: | Oracle JRockit(R) (build P28.0.0-29-114096-1.6.0_11-20090427-1759-windows-x86_64, compiled mode) |
| JVM Command-line Options: | -Xms1650m -Xmx1650m -Xns1500m -XXaggressive -XlargePages -XXthroughputCompaction -XXcallprofiling -XXlazyUnlocking -Xgc:genpar -XXgcthreads:4 -XXtlasize:min=12k,preferred=1024k |
| JVM Affinity: | start /affinity [F,F0,F00,F000] |
| JVM Instances: | 4 |
| JVM Initial Heap (MB): | 1650 |
| JVM Maximum Heap (MB): | 1650 |
| JVM Address Bits: | 64 |
| Boot Firmware Version: | I22 06/01/2009 |
| Management Firmware Version: | 1.77 03/30/2009 |
| Workload Version: | SSJ 1.2.6 |
| Director Location: | Controller |
| Other Software: | None |
| JVM Instance | ssj_ops@100% |
|---|---|
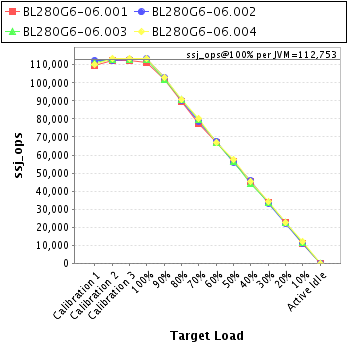
| BL280G6-06.001 | 111,373 |
| BL280G6-06.002 | 113,377 |
| BL280G6-06.003 | 112,831 |
| BL280G6-06.004 | 113,431 |
| ssj_ops@100% | 451,012 |
| ssj_ops@100% per JVM | 112,753 |
| Target Load | Actual Load | ssj_ops | |
|---|---|---|---|
| Target | Actual | ||
| Calibration 1 | 109,355 | ||
| Calibration 2 | 112,156 | ||
| Calibration 3 | 112,329 | ||
| ssj_ops@calibrated=112,243 | |||
| 100% | 99.2% | 112,243 | 111,373 |
| 90% | 90.7% | 101,018 | 101,794 |
| 80% | 79.8% | 89,794 | 89,600 |
| 70% | 69.1% | 78,570 | 77,562 |
| 60% | 59.6% | 67,346 | 66,928 |
| 50% | 50.3% | 56,121 | 56,420 |
| 40% | 40.3% | 44,897 | 45,231 |
| 30% | 29.9% | 33,673 | 33,555 |
| 20% | 20.2% | 22,449 | 22,718 |
| 10% | 9.8% | 11,224 | 11,012 |
| Active Idle | 0 | 0 | |

| Target Load | Actual Load | ssj_ops | |
|---|---|---|---|
| Target | Actual | ||
| Calibration 1 | 112,355 | ||
| Calibration 2 | 112,476 | ||
| Calibration 3 | 113,193 | ||
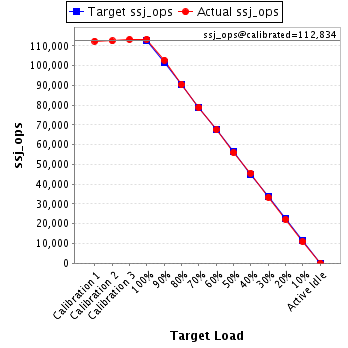
| ssj_ops@calibrated=112,834 | |||
| 100% | 100.5% | 112,834 | 113,377 |
| 90% | 91.1% | 101,551 | 102,761 |
| 80% | 80.1% | 90,268 | 90,373 |
| 70% | 69.8% | 78,984 | 78,800 |
| 60% | 59.9% | 67,701 | 67,619 |
| 50% | 49.6% | 56,417 | 55,970 |
| 40% | 40.4% | 45,134 | 45,634 |
| 30% | 29.6% | 33,850 | 33,351 |
| 20% | 19.6% | 22,567 | 22,150 |
| 10% | 9.7% | 11,283 | 10,975 |
| Active Idle | 0 | 0 | |
| Target Load | Actual Load | ssj_ops | |
|---|---|---|---|
| Target | Actual | ||
| Calibration 1 | 111,127 | ||
| Calibration 2 | 113,155 | ||
| Calibration 3 | 112,937 | ||
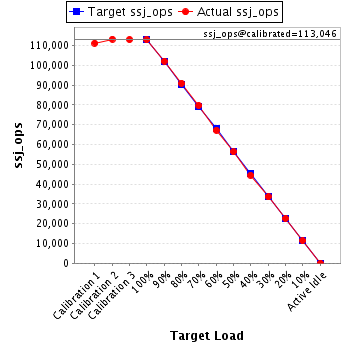
| ssj_ops@calibrated=113,046 | |||
| 100% | 99.8% | 113,046 | 112,831 |
| 90% | 90.3% | 101,741 | 102,081 |
| 80% | 80.4% | 90,437 | 90,941 |
| 70% | 70.5% | 79,132 | 79,695 |
| 60% | 59.4% | 67,828 | 67,134 |
| 50% | 49.8% | 56,523 | 56,256 |
| 40% | 39.3% | 45,218 | 44,443 |
| 30% | 29.7% | 33,914 | 33,543 |
| 20% | 20.1% | 22,609 | 22,695 |
| 10% | 10.1% | 11,305 | 11,441 |
| Active Idle | 0 | 0 | |
| Target Load | Actual Load | ssj_ops | |
|---|---|---|---|
| Target | Actual | ||
| Calibration 1 | 110,245 | ||
| Calibration 2 | 113,544 | ||
| Calibration 3 | 113,675 | ||
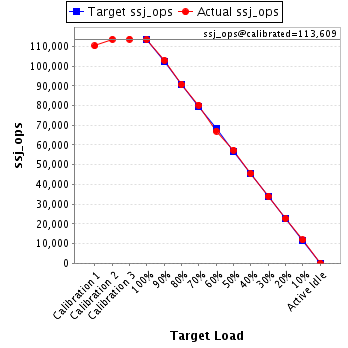
| ssj_ops@calibrated=113,609 | |||
| 100% | 99.8% | 113,609 | 113,431 |
| 90% | 90.6% | 102,249 | 102,960 |
| 80% | 79.8% | 90,888 | 90,688 |
| 70% | 70.6% | 79,527 | 80,211 |
| 60% | 59.1% | 68,166 | 67,088 |
| 50% | 50.5% | 56,805 | 57,379 |
| 40% | 40.0% | 45,444 | 45,467 |
| 30% | 29.9% | 34,083 | 34,003 |
| 20% | 20.0% | 22,722 | 22,728 |
| 10% | 10.4% | 11,361 | 11,829 |
| Active Idle | 0 | 0 | |