SPECpower_ssj2008
Host 'BL280G6-05' Performance Report
Copyright © 2007-2009 Standard Performance Evaluation Corporation
| Hewlett-Packard Company ProLiant BL280c G6 | ssj_ops@100% = 448,389 ssj_ops@100% per JVM = 112,097 |
||||
| Test Sponsor: | Hewlett-Packard Company | SPEC License #: | 3 | Test Method: | Multi Node |
| Tested By: | Hewlett-Packard Company | Test Location: | Houston, TX, USA | Test Date: | Jun 25, 2009 |
| Hardware Availability: | Aug-2009 | Software Availability: | Aug-2009 | Publication: | Jul 15, 2009 |
| System Source: | Single Supplier | System Designation: | Server | Power Provisioning: | Line-powered |
| Target Load | Actual Load | ssj_ops | |
|---|---|---|---|
| Target | Actual | ||
| Calibration 1 | 441,888 | ||
| Calibration 2 | 446,685 | ||
| Calibration 3 | 447,776 | ||
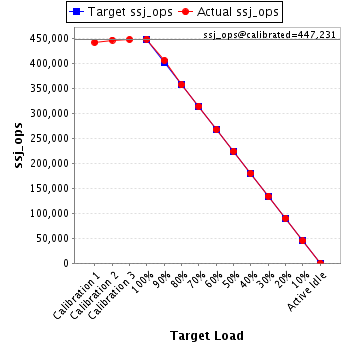
| ssj_ops@calibrated=447,231 | |||
| 100% | 100.3% | 447,231 | 448,389 |
| 90% | 90.8% | 402,508 | 405,914 |
| 80% | 79.8% | 357,784 | 356,889 |
| 70% | 70.3% | 313,061 | 314,228 |
| 60% | 59.8% | 268,338 | 267,552 |
| 50% | 50.2% | 223,615 | 224,415 |
| 40% | 40.2% | 178,892 | 179,942 |
| 30% | 30.1% | 134,169 | 134,416 |
| 20% | 20.2% | 89,446 | 90,327 |
| 10% | 10.0% | 44,723 | 44,827 |
| Active Idle | 0 | 0 | |
| Set Identifier: | sut |
| Set Description: | System Under Test |
| # of Identical Nodes: | 16 |
| Comment: | None |
| Hardware | |
|---|---|
| Hardware Vendor: | Hewlett-Packard Company |
| Model: | ProLiant BL280c G6 |
| Form Factor: | Blade |
| CPU Name: | Intel Xeon L5520 |
| CPU Characteristics: | 2.27GHz, 8 MB L3, 1333 MHz system bus |
| CPU Frequency (MHz): | 2267 |
| CPU(s) Enabled: | 8 cores, 2 chips, 4 cores/chip |
| Hardware Threads: | 16 (2 / core) |
| CPU(s) Orderable: | 1,2 chips |
| Primary Cache: | 32 KB I + 32 KB D on chip per core |
| Secondary Cache: | 256 KB I+D on chip per core |
| Tertiary Cache: | 8 MB I+D on chip per chip |
| Other Cache: | None |
| Memory Amount (GB): | 8.0 |
| # and size of DIMM: | 4 x 2048 MB |
| Memory Details: | PC3-10600E; Slots 2A and 4B populated on each CPU node |
| Power Supply Quantity and Rating (W): | None |
| Power Supply Details: | Shared |
| Disk Drive: | 1 x 32 GB SSD 2.5" SATA; HP part #461201-B21 |
| Disk Controller: | Integrated SATA controller |
| # and type of Network Interface Cards (NICs) Installed: | 2 x NC362i |
| NICs Enabled in Firmware / OS / Connected: | 2/2/1 |
| Network Speed (Mbit): | 1000 |
| Keyboard: | None |
| Mouse: | None |
| Monitor: | None |
| Optical Drives: | No |
| Other Hardware: | None |
| Software | |
|---|---|
| Power Management: | Enabled (see SUT Notes) |
| Operating System (OS): | Microsoft Windows Server 2008 x64 Enterprise Edition |
| OS Version: | Service Pack 2 |
| Filesystem: | NTFS |
| JVM Vendor: | Oracle Corporation |
| JVM Version: | Oracle JRockit(R) (build P28.0.0-29-114096-1.6.0_11-20090427-1759-windows-x86_64, compiled mode) |
| JVM Command-line Options: | -Xms1650m -Xmx1650m -Xns1500m -XXaggressive -XlargePages -XXthroughputCompaction -XXcallprofiling -XXlazyUnlocking -Xgc:genpar -XXgcthreads:4 -XXtlasize:min=12k,preferred=1024k |
| JVM Affinity: | start /affinity [F,F0,F00,F000] |
| JVM Instances: | 4 |
| JVM Initial Heap (MB): | 1650 |
| JVM Maximum Heap (MB): | 1650 |
| JVM Address Bits: | 64 |
| Boot Firmware Version: | I22 06/01/2009 |
| Management Firmware Version: | 1.77 03/30/2009 |
| Workload Version: | SSJ 1.2.6 |
| Director Location: | Controller |
| Other Software: | None |
| JVM Instance | ssj_ops@100% |
|---|---|
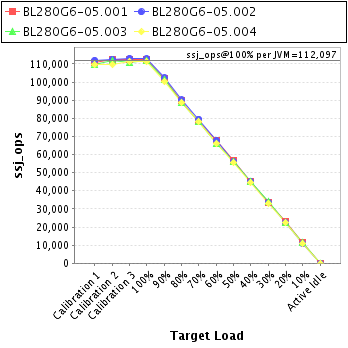
| BL280G6-05.001 | 112,293 |
| BL280G6-05.002 | 112,826 |
| BL280G6-05.003 | 112,009 |
| BL280G6-05.004 | 111,261 |
| ssj_ops@100% | 448,389 |
| ssj_ops@100% per JVM | 112,097 |
| Target Load | Actual Load | ssj_ops | |
|---|---|---|---|
| Target | Actual | ||
| Calibration 1 | 110,905 | ||
| Calibration 2 | 112,310 | ||
| Calibration 3 | 112,424 | ||
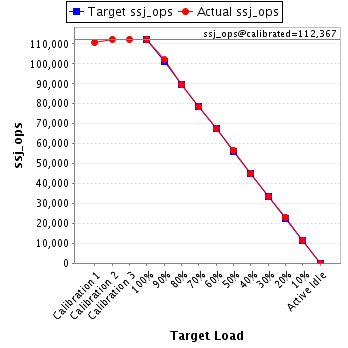
| ssj_ops@calibrated=112,367 | |||
| 100% | 99.9% | 112,367 | 112,293 |
| 90% | 90.8% | 101,130 | 102,007 |
| 80% | 79.7% | 89,893 | 89,545 |
| 70% | 69.8% | 78,657 | 78,408 |
| 60% | 60.1% | 67,420 | 67,537 |
| 50% | 50.4% | 56,183 | 56,656 |
| 40% | 39.9% | 44,947 | 44,849 |
| 30% | 29.9% | 33,710 | 33,636 |
| 20% | 20.6% | 22,473 | 23,163 |
| 10% | 10.4% | 11,237 | 11,645 |
| Active Idle | 0 | 0 | |
| Target Load | Actual Load | ssj_ops | |
|---|---|---|---|
| Target | Actual | ||
| Calibration 1 | 112,091 | ||
| Calibration 2 | 112,710 | ||
| Calibration 3 | 113,175 | ||
| ssj_ops@calibrated=112,942 | |||
| 100% | 99.9% | 112,942 | 112,826 |
| 90% | 90.6% | 101,648 | 102,347 |
| 80% | 79.8% | 90,354 | 90,102 |
| 70% | 70.5% | 79,060 | 79,606 |
| 60% | 60.0% | 67,765 | 67,740 |
| 50% | 49.8% | 56,471 | 56,300 |
| 40% | 40.0% | 45,177 | 45,178 |
| 30% | 29.9% | 33,883 | 33,790 |
| 20% | 19.8% | 22,588 | 22,416 |
| 10% | 9.7% | 11,294 | 10,962 |
| Active Idle | 0 | 0 | |

| Target Load | Actual Load | ssj_ops | |
|---|---|---|---|
| Target | Actual | ||
| Calibration 1 | 109,420 | ||
| Calibration 2 | 111,883 | ||
| Calibration 3 | 110,596 | ||
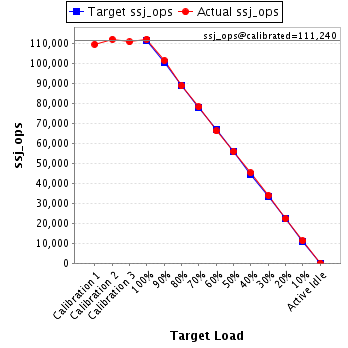
| ssj_ops@calibrated=111,240 | |||
| 100% | 100.7% | 111,240 | 112,009 |
| 90% | 91.0% | 100,116 | 101,270 |
| 80% | 79.7% | 88,992 | 88,643 |
| 70% | 70.2% | 77,868 | 78,131 |
| 60% | 59.5% | 66,744 | 66,137 |
| 50% | 50.2% | 55,620 | 55,891 |
| 40% | 40.6% | 44,496 | 45,197 |
| 30% | 30.4% | 33,372 | 33,847 |
| 20% | 20.0% | 22,248 | 22,278 |
| 10% | 10.1% | 11,124 | 11,212 |
| Active Idle | 0 | 0 | |
| Target Load | Actual Load | ssj_ops | |
|---|---|---|---|
| Target | Actual | ||
| Calibration 1 | 109,471 | ||
| Calibration 2 | 109,783 | ||
| Calibration 3 | 111,581 | ||
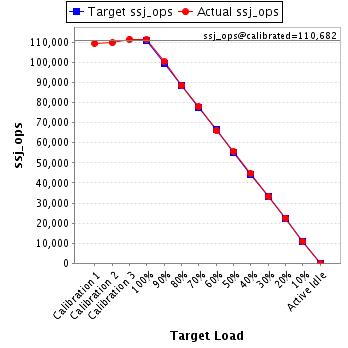
| ssj_ops@calibrated=110,682 | |||
| 100% | 100.5% | 110,682 | 111,261 |
| 90% | 90.6% | 99,614 | 100,290 |
| 80% | 80.0% | 88,545 | 88,599 |
| 70% | 70.5% | 77,477 | 78,082 |
| 60% | 59.8% | 66,409 | 66,138 |
| 50% | 50.2% | 55,341 | 55,568 |
| 40% | 40.4% | 44,273 | 44,718 |
| 30% | 29.9% | 33,205 | 33,143 |
| 20% | 20.3% | 22,136 | 22,470 |
| 10% | 9.9% | 11,068 | 11,008 |
| Active Idle | 0 | 0 | |