SPECpower_ssj2008
Copyright © 2007-2008 Standard Performance Evaluation Corporation
| Dell Inc. PowerEdge Energy Smart 1950 III (Intel Xeon L5420) | SPECpower_ssj2008 = 744 overall ssj_ops/watt | ||||
| Test Sponsor: | Dell Inc. | SPEC License #: | 55 | Test Method: | Single Node |
| Tested By: | Dell Inc. | Test Location: | Round Rock, TX, USA | Test Date: | Jun 18, 2008 |
| Hardware Availability: | May-2008 | Software Availability: | Mar-2008 | Publication: | Jul 31, 2008 |
| System Source: | Single Supplier | System Designation: | Server | Power Provisioning: | Line-powered |
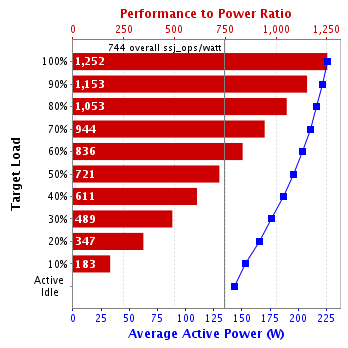
| Performance | Power | Performance to Power Ratio | ||
|---|---|---|---|---|
| Target Load | Actual Load | ssj_ops | Average Active Power (W) | |
| 100% | 99.5% | 282,904 | 226 | 1,252 |
| 90% | 89.8% | 255,378 | 222 | 1,153 |
| 80% | 80.2% | 228,157 | 217 | 1,053 |
| 70% | 70.0% | 199,059 | 211 | 944 |
| 60% | 60.0% | 170,518 | 204 | 836 |
| 50% | 49.7% | 141,502 | 196 | 721 |
| 40% | 40.2% | 114,231 | 187 | 611 |
| 30% | 30.4% | 86,469 | 177 | 489 |
| 20% | 20.2% | 57,474 | 166 | 347 |
| 10% | 9.9% | 28,141 | 154 | 183 |
| Active Idle | 0 | 143 | 0 | |
| ∑ssj_ops / ∑power = | 744 | |||
| Set Identifier: | sut |
| Set Description: | PowerEdge Energy Smart 1950 III (Intel Xeon L5420) |
| # of Identical Nodes: | 1 |
| Comment: | None |
| Hardware | |
|---|---|
| Hardware Vendor: | Dell Inc. |
| Model: | PowerEdge Energy Smart 1950 III (Intel Xeon L5420) |
| Form Factor: | -- |
| CPU Name: | Intel Xeon L5420 |
| CPU Characteristics: | Quad-Core, 2.50GHz, 1333MHz System Bus |
| CPU Frequency (MHz): | 2500 |
| CPU(s) Enabled: | 8 cores, 2 chips, 4 cores/chip |
| Hardware Threads: | 8 (1 / core) |
| CPU(s) Orderable: | 1,2 chips |
| Primary Cache: | 32 KB I + 32 KB D on chip per core |
| Secondary Cache: | 12 MB I+D on chip per chip, 6MB shared/2 cores |
| Tertiary Cache: | None |
| Other Cache: | None |
| Memory Amount (GB): | 8 |
| # and size of DIMM: | 4 x 2048 MB |
| Memory Details: | DDR2-667 CL5 FBDIMM; Slots 1,3,5,7 populated |
| Power Supply Quantity and Rating (W): | 1 x 670 |
| Power Supply Details: | Dell P/N UU452 |
| Disk Drive: | 1 x 73GB 10K RPM SAS |
| Disk Controller: | SAS 6iR |
| # and type of Network Interface Cards (NICs) Installed: | 2 x Onboard Gigabit |
| NICs Enabled in Firmware / OS / Connected: | 2/2/1 |
| Network Speed (Mbit): | 1000 |
| Keyboard: | KVM |
| Mouse: | KVM |
| Monitor: | KVM |
| Optical Drives: | Yes |
| Other Hardware: | None |
| Software | |
|---|---|
| Power Management: | Enabled (Server Balanced Power and Performance) |
| Operating System (OS): | Microsoft Windows Server 2003 R2 Enterprise x64 Edition |
| OS Version: | Service Pack 2 |
| Filesystem: | NTFS |
| JVM Vendor: | BEA Systems, Inc. |
| JVM Version: | BEA JRockit (R) (build P27.5.0-5-97156-1.6.0_03-20080403-1524-windows-x86_64, compiled mode) |
| JVM Command-line Options: | -Xms1600m -Xns1400m -Xmx1600m -XXaggressive -XXthroughputcompaction -XXcallprofiling -Xgc:genpar -XXgcthreads=2 -XXtlasize:min=4k,preferred=256k |
| JVM Affinity: | start /affinity [03,0C,30,C0] |
| JVM Instances: | 8 |
| JVM Initial Heap (MB): | 1600 |
| JVM Maximum Heap (MB): | 1600 |
| JVM Address Bits: | 64 |
| Boot Firmware Version: | -- |
| Management Firmware Version: | -- |
| Workload Version: | SSJ 1.1 |
| Director Location: | Controller |
| Other Software: | None |
| Hardware | |
|---|---|
| Hardware Vendor: | Dell Inc. |
| Model: | PowerEdge 1950 |
| CPU Description: | Intel Xeon 5160 |
| Memory amount (GB): | 4 |
| Software | |
|---|---|
| Operating System (OS): | Windows 2003 Server Enterprise Edition |
| JVM Vendor: | BEA Systems, Inc. |
| JVM Version: | build R26.4.0-63-63688-1.5.0_06-20060626-2259-win-ia32 |
| CCS Version: | 1.1 |
| Power Analyzer pwr1 | |
|---|---|
| Hardware Vendor: | Instek Corporation |
| Model: | GPM-8212 |
| Serial Number: | CH190096 |
| Connectivity: | RS-232 |
| Input Connection: | -- |
| Calibration Institute: | NIST |
| Accredited by: | Davis Calibration |
| Calibration Label: | 1997285 |
| Date of Calibration: | Jan-2008 |
| PTDaemon Host System: | same as CCS |
| PTDaemon Host OS: | same as CCS |
| PTDaemon Version: | 1.2-13f4b0b4 |
| Setup Description: | -- |
| Temperature Sensor temp1 | |
|---|---|
| Hardware Vendor: | Digi International |
| Model: | Watchport/H |
| Driver Version: | 4.2.0.0 |
| Connectivity: | USB |
| PTDaemon Host System: | same as CCS |
| PTDaemon Host OS: | same as CCS |
| Setup Description: | -- |
| Target Load | Average Active Power (W) | Minimum Ambient Temperature (°C) |
|---|---|---|
| 100% | 226 | 25.2 |
| 90% | 222 | 25.2 |
| 80% | 217 | 25.2 |
| 70% | 211 | 25.2 |
| 60% | 204 | 25.1 |
| 50% | 196 | 25.1 |
| 40% | 187 | 25.1 |
| 30% | 177 | 25.1 |
| 20% | 166 | 25.1 |
| 10% | 154 | 25.1 |
| Active Idle | 143 | 25.1 |
| Line Standard | Minimum Temperature (°C) | Elevation (m) |
|---|---|---|
| 208V / 60 Hz / 1 phase / 2 wires | 25.1 | 250 |
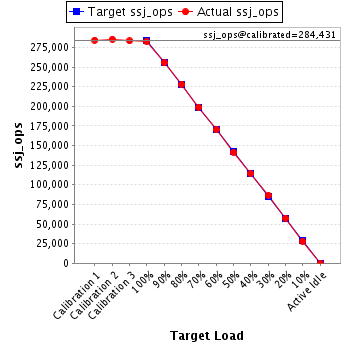
| Target Load | Actual Load | ssj_ops | |
|---|---|---|---|
| Target | Actual | ||
| Calibration 1 | 284,426 | ||
| Calibration 2 | 285,576 | ||
| Calibration 3 | 283,286 | ||
| ssj_ops@calibrated=284,431 | |||
| 100% | 99.5% | 284,431 | 282,904 |
| 90% | 89.8% | 255,988 | 255,378 |
| 80% | 80.2% | 227,545 | 228,157 |
| 70% | 70.0% | 199,102 | 199,059 |
| 60% | 60.0% | 170,659 | 170,518 |
| 50% | 49.7% | 142,215 | 141,502 |
| 40% | 40.2% | 113,772 | 114,231 |
| 30% | 30.4% | 85,329 | 86,469 |
| 20% | 20.2% | 56,886 | 57,474 |
| 10% | 9.9% | 28,443 | 28,141 |
| Active Idle | 0 | 0 | |