SPECpower_ssj2008
Copyright © 2007-2008 Standard Performance Evaluation Corporation
| Dell Inc. PowerEdge 1950 III (Intel Xeon E5440) | SPECpower_ssj2008 = 712 overall ssj_ops/watt | ||||
| Test Sponsor: | Dell Inc. | SPEC License #: | 55 | Test Method: | Single Node |
| Tested By: | Dell Inc. | Test Location: | Round Rock, TX, USA | Test Date: | Feb 7, 2008 |
| Hardware Availability: | Mar-2008 | Software Availability: | Oct-2007 | Publication: | Feb 27, 2008 |
| System Source: | Single Supplier | System Designation: | Server | Power Provisioning: | Line-powered |
| Performance | Power | Performance to Power Ratio | ||
|---|---|---|---|---|
| Target Load | Actual Load | ssj_ops | Average Active Power (W) | |
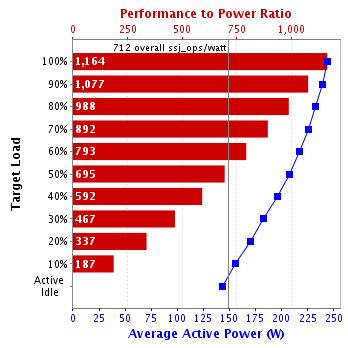
| 100% | 99.0% | 284,028 | 244 | 1,164 |
| 90% | 89.8% | 257,533 | 239 | 1,077 |
| 80% | 80.2% | 230,234 | 233 | 988 |
| 70% | 70.3% | 201,611 | 226 | 892 |
| 60% | 60.2% | 172,604 | 218 | 793 |
| 50% | 50.3% | 144,236 | 208 | 695 |
| 40% | 40.4% | 115,928 | 196 | 592 |
| 30% | 29.7% | 85,343 | 183 | 467 |
| 20% | 20.0% | 57,402 | 170 | 337 |
| 10% | 10.1% | 29,070 | 156 | 187 |
| Active Idle | 0 | 143 | 0 | |
| ∑ssj_ops / ∑power = | 712 | |||
| Set Identifier: | sut |
| Set Description: | PowerEdge 1950 III (Intel Xeon E5440) |
| # of Identical Nodes: | 1 |
| Comment: | None |
| Hardware | |
|---|---|
| Hardware Vendor: | Dell Inc. |
| Model: | PowerEdge 1950 III (Intel Xeon E5440) |
| Form Factor: | -- |
| CPU Name: | Intel Xeon E5440 |
| CPU Characteristics: | 1333 MHz system bus |
| CPU Frequency (MHz): | 2833 |
| CPU(s) Enabled: | 8 cores, 2 chips, 4 cores/chip |
| Hardware Threads: | 8 (1 / core) |
| CPU(s) Orderable: | 1,2 chips |
| Primary Cache: | 32KB I + 32KB D on chip per core |
| Secondary Cache: | 12 MB I+D on chip per chip, 6 MB shared/2 cores |
| Tertiary Cache: | None |
| Other Cache: | None |
| Memory Amount (GB): | 8 |
| # and size of DIMM: | 4x2048MB |
| Memory Details: | DDR2-667 CL5 FBDIMM; slots 1, 3, 5, and 7 populated |
| Power Supply Quantity and Rating (W): | 1 x 670 |
| Power Supply Details: | Dell P/N UU452 |
| Disk Drive: | 1 x 73GB 10K RPM 2.5" SAS |
| Disk Controller: | SAS 6iR |
| # and type of Network Interface Cards (NICs) Installed: | 2 x Onboard Gigabit |
| NICs Enabled in Firmware / OS / Connected: | 2/2/1 |
| Network Speed (Mbit): | 1000 |
| Keyboard: | KVM |
| Mouse: | KVM |
| Monitor: | KVM |
| Optical Drives: | Yes |
| Other Hardware: | None |
| Software | |
|---|---|
| Power Management: | Enabled (Server Balanced Power and Performance) |
| Operating System (OS): | Microsoft Windows Server 2003 R2 Enterprise x64 Edition |
| OS Version: | Service Pack 2 |
| Filesystem: | NTFS |
| JVM Vendor: | BEA Systems, Inc. |
| JVM Version: | BEA JRockit(R) 6 P27.4.0-10 (build P27.4.0-10-90053-1.6.0_02-20071009-1827-windows-x86_64) |
| JVM Command-line Options: | -Xms3300m -Xns2900m -Xmx3300m -XXaggressive -XXthroughputcompaction -XXlazyunlocking -XXcallprofiling -Xgc:genpar -XXgcthreads=2 -XXtlasize:min=4k,preferred=512k |
| JVM Affinity: | start /affinity [0f,f0] |
| JVM Instances: | 4 |
| JVM Initial Heap (MB): | 3300 |
| JVM Maximum Heap (MB): | 3300 |
| JVM Address Bits: | 64 |
| Boot Firmware Version: | -- |
| Management Firmware Version: | -- |
| Workload Version: | SSJ 1.1 |
| Director Location: | Controller |
| Other Software: | None |
| Hardware | |
|---|---|
| Hardware Vendor: | Dell Inc. |
| Model: | PowerEdge 1950 |
| CPU Description: | Intel Xeon 5160 |
| Memory amount (GB): | 4 |
| Software | |
|---|---|
| Operating System (OS): | Microsoft Windows 2003 Server Enterprise Edition |
| JVM Vendor: | BEA Systems, Inc. |
| JVM Version: | JRockit(R) 1.6.0_02 build R26.4.0-63 (32-bit) |
| CCS Version: | 1.1 |
| Power Analyzer pwr1 | |
|---|---|
| Hardware Vendor: | Yokogawa Electric International Pte. Ltd. |
| Model: | WT210 |
| Serial Number: | 91G643889 |
| Connectivity: | RS-232 |
| Input Connection: | -- |
| Calibration Institute: | NIST |
| Accredited by: | Yokogawa Electric International Pte. Ltd. |
| Calibration Label: | 07-1458 |
| Date of Calibration: | 24-Oct-2007 |
| PTDaemon Host System: | Controller |
| PTDaemon Host OS: | Controller |
| PTDaemon Version: | 1.1-45c8e665 |
| Setup Description: | -- |
| Temperature Sensor temp1 | |
|---|---|
| Hardware Vendor: | Digi International Inc. |
| Model: | Watchport/H |
| Driver Version: | Watchport Virtual Port 4.20.0.0 |
| Connectivity: | USB |
| PTDaemon Host System: | Controller |
| PTDaemon Host OS: | Controller |
| Setup Description: | -- |
| Target Load | Average Active Power (W) | Minimum Ambient Temperature (°C) |
|---|---|---|
| 100% | 244 | 22.5 |
| 90% | 239 | 22.5 |
| 80% | 233 | 22.5 |
| 70% | 226 | 22.5 |
| 60% | 218 | 22.5 |
| 50% | 208 | 22.5 |
| 40% | 196 | 22.5 |
| 30% | 183 | 22.5 |
| 20% | 170 | 22.5 |
| 10% | 156 | 22.5 |
| Active Idle | 143 | 22.5 |
| Line Standard | Minimum Temperature (°C) | Elevation (m) |
|---|---|---|
| 208V / 60 Hz / 1 phase / 2 wires | 22.5 | 250 |
| Target Load | Actual Load | ssj_ops | |
|---|---|---|---|
| Target | Actual | ||
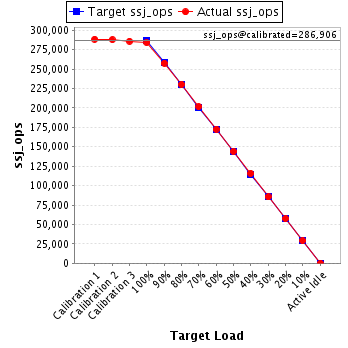
| Calibration 1 | 288,490 | ||
| Calibration 2 | 287,765 | ||
| Calibration 3 | 286,047 | ||
| ssj_ops@calibrated=286,906 | |||
| 100% | 99.0% | 286,906 | 284,028 |
| 90% | 89.8% | 258,215 | 257,533 |
| 80% | 80.2% | 229,525 | 230,234 |
| 70% | 70.3% | 200,834 | 201,611 |
| 60% | 60.2% | 172,144 | 172,604 |
| 50% | 50.3% | 143,453 | 144,236 |
| 40% | 40.4% | 114,762 | 115,928 |
| 30% | 29.7% | 86,072 | 85,343 |
| 20% | 20.0% | 57,381 | 57,402 |
| 10% | 10.1% | 28,691 | 29,070 |
| Active Idle | 0 | 0 | |